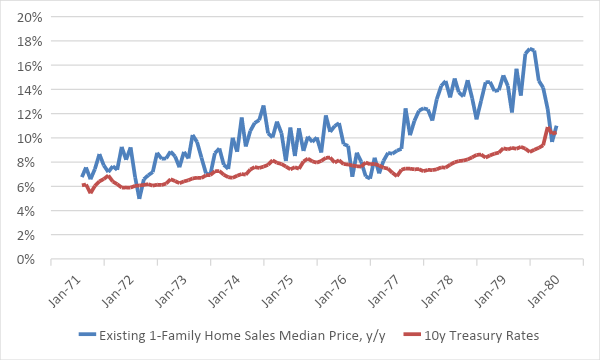
- Higher mortgage rates historically associated with higher house price growth
- Buying a real asset with levered, tax-advantage loans is still a good idea
- This week we will see an acceleration in money velocity when Q2 GDP is reported.
- further sharp declines in Existing Home Sales, to an annual rate of only 5.12 million versus expectations for 5.35 million, and far below the 6.49 million pace of January
- a continued rise in median home prices, +1.90% mom and +13.3% yoy
There is a lot of data this week, but of those, there are really two bits of information that are illuminating at some level on inflation.
First, we will get a number of housing-related indicators. There is a huge debate at the moment between people who have a 15-year memory and expect home prices to collapse as the economy slows, and people who have a 50-year memory and expect home prices to continue to do pretty well as inflation supports the nominal prices of real assets.
I am a dinosaur, or an elephant, or an elephantine dinosaur, and I have a long memory. I also lived and traded inflation markets through the 2007-2009 collapse; so I remember very poignantly how unique that period was. Count me in the camp that expects home prices to decline in real terms, but not in nominal terms.
Naturally, increases in mortgage rates have a dampening effect on home-buying traffic and home sales. Increasing the monthly mortgage payment by 40% will price some buyers out of the market. But the important thing to say is that rational buyers will still buy, unless they actively expect home prices to underperform inflation for an extended period of time. Here’s why:
If I can buy a product that is growing at the rate of inflation—as home prices do, over long periods of time, and finance that at less (after tax) than the rate of inflation, then it’s a win.
Suppose a home buyer is taxed at the top marginal tax rate of 37%, and gets a 5% mortgage with 20% down on a $500,000 home. Then the homeowner will break even—ignoring property taxes, but also ignoring the value of the home as a place to live—if this is true:
Rise in home equity = after-tax mortgage cost
Home value today * expected inflation = (1-tax rate) * 5% * financed amount
$500,000 * expected inflation = (1-0.37) * (5% * $400,000)
$500,000 * expected inflation = $12,600
Expected inflation = $12,600 / $500,000
Expected inflation = 2.52%
Ergo, even if inflation falls to the Fed’s target level, and home prices do no more than keeping up with inflation, the homeowner still breaks even on the investment portion of the home ownership decision.
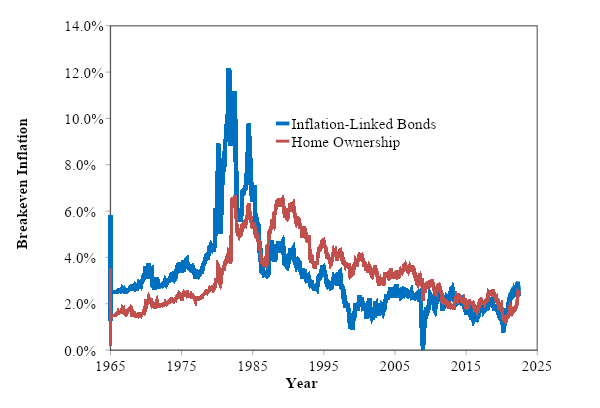
Yes, that’s not as attractive as it was a year ago. Here’s a handy little chart showing inflation breakevens from TIPS (using the Enduring Investments’ derived real yields series prior to 1997) and from home ownership. I always use the top tax bracket, and assume the home is 80% financed at the 10-year Treasury rate + 2%.

Source: Enduring Investments calculations
The breakeven inflation rate from homeownership right now is just about the same as the breakeven on TIPS, and even with the sharp rise in mortgage rates, they’re still a much better bet than they were prior to the housing bubble, which relied on home prices rising much faster than inflation for a long time.
Last week, we saw:
This will surely decelerate further. However, over the last three months Existing Home Sales Median Prices, roughly seasonally adjusted, rose at a 7.4% annualized pace. That happens to be exactly the same rate that the Cleveland Fed’s Median CPI rose over the same period. It isn’t clear to me that nominal prices must decline, if inflation stays high.
And, indeed, this is what history tells us. In the 1970s, as interest rates rose, home prices did not decline. In fact, they rose faster.

Source Bloomberg, National Association of Realtors
Naturally, that is because these two series are related to a third thing: inflation. This is yet another reminder to think in real space, not nominal space. Will home prices decline after inflation? Quite possibly. Will home prices decline in nominal terms, because interest rates have risen? This seems unlikely. The FHFA House Price Index and the S&P CoreLogic Case-Shiller Index are both released on Tuesday. Both will remain elevated for this month, and for a while.
Taking a Step Back…
I did mention that there would be two bits of information this week that would be interested and bear on inflation. The second is associated with the release this week of the advance estimate of Q2 GDP on Thursday. There is a chance that GDP will show a second consecutive quarter of contraction, in which case all of the pundits will run around as if their hair is on fire, declaring that we are in a recession. Or, GDP may show small positive growth, in which case the same pundits will pronounce gravely that the country narrowly avoided a recession. Neither, of course, is true since GDP is not the sole metric by which we determine whether the economy is in recession. And it certainly doesn’t feel like it is, yet. I continue to believe strongly that we will have a recession, since increases in interest rates and energy prices such as we have seen are always associated with subsequent recessions. Perhaps, though, not yet.
However, I don’t really care about the growth number. No matter what it is, what we know is that money velocity almost certainly jumped substantially in Q2. We haven’t actually gotten the June M2 figure yet, so it is hard to say by how much M2 Velocity will rise. But it will be substantial. We know that, because the change in velocity is mathematically the change in prices plus the change in real growth minus the change in the money supply. The GDP Price Index is expected to rise about 2% for the quarter, with Real GDP roughly flat as I said. And M2, for April and May compared to the first quarter average, was flat. Therefore, velocity ought to rise in the neighborhood of 2%, or 8% annualized.
If that happens, it will be the biggest percentage increase in M2 velocity since the first quarter of 1981, (except for 2020 Q3 when it bounced after a 21% decline in 2020 Q2). Our model is expecting this increase, and unless something very terrible happens we have likely seen the all-time lows for money velocity. This matters, because without a steadily-declining money velocity, keeping inflation low will require money growth to be reined in to levels we have not seen since the early 1990s. And since the Fed is not focused on money growth, if this happens it won’t be on purpose.
Disclosure: My company and/or funds and accounts we manage have positions in inflation-indexed bonds and various commodity and financial futures products and ETFs, that may be mentioned from time to time in this column.
