
- All Instrument Types
- Indices
- Equities
- ETFs
- Funds
- Commodities
- Currencies
- Crypto
- Bonds
- Certificates
Please try another search

Week Ahead: Investor Optimism To Drive Stocks Up Even As Grim Data Continues

- Stocks have been climbing on the hope of a V-shaped recovery amid the promise of infinite QE, even as the Fed itself said that wouldn’t be enough
- Treasurys advanced Friday, together with equities–a potential sign of a pullback
- The USD may rally before continuing lower, allowing gold to move higher
The only thing investors appear to be seeing is the light at the end of the lockdown tunnel, as economies around the world continue reopening and government regulators keep issuing unprecedented amounts of fiscal easing, even as equity bulls turn a blind eye toward ongoing, devastating economic data and the revival of US-China tensions.
The S&P 500 Index climbed 0.5% on Friday, finishing the week 3% higher—a second consecutive weekly advance for a total of +6.3%. It also marked a monthly acceleration for the SPX just a hair under 5% and the second straight monthly gain for a total of 17.8%, the best two-month performance for the index since 2009.
Still, not all the news last week was encouraging. US GDP dropped at an annualized rate of -5.0% in the first quarter, the worst performance for this metric since the last quarter of 2008, when the US was in the midst of the great recessionary storm, during which six years of continuous growth collapsed. And some version of history could be repeating now. Fed Chair Jerome Powell, in a televised interview, told "60 Minutes," growth could shrink another 30%.
As well, in early April, the IMF predicted “the worst downturn since the Great Depression." Indeed, personal spending plunged a record 13.6% in April
Investor Exuberance, Grim Economic Data
But all that doesn’t seem to concern equity bulls. While only two weeks ago the Fed warned of a slow recovery, with “significant” financial vulnerabilities, in which asset prices could suffer without yet more virus relief from the government, traders still aren't looking back, barreling past some of the worst economic data any of us have seen in our lifetimes. And analysts expect "more shocking economic data in the week ahead," with many anticipating the US unemployment rate will have neared 20% in May.
All told, the S&P 500 catapulted a whopping 36% higher since the March 23 bottom, even with the month-long lethargy shown in the sideways move from mid-April to mid-May.
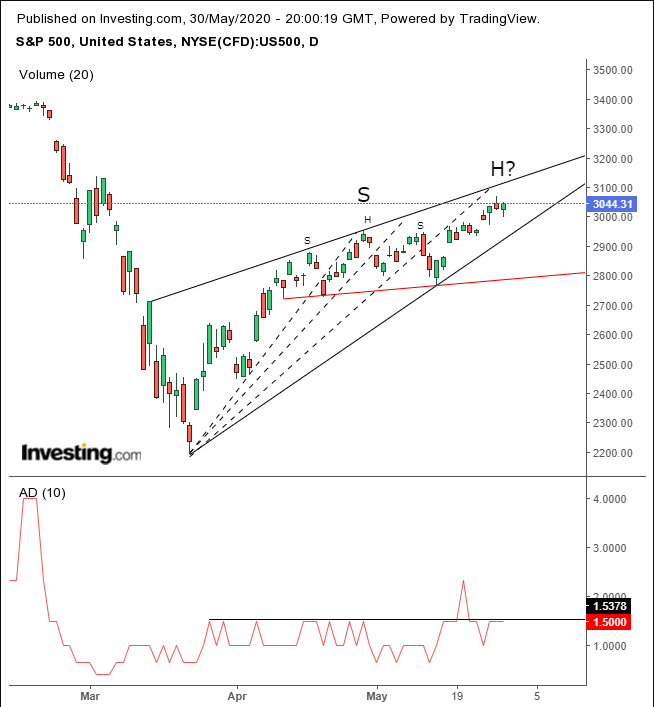
To be honest, we’re a bit self-conscious about predicting that stocks could be headed lower, when prices repeatedly keep blowing out what look to us like bearish patterns. Most recently, the S&P 500 blew out a small H&S pattern and continued making new highs after seemingly completing rising wedges.
In fact, the price may still be forming a much larger H&S top, in which our initial, small H&S makes up its left shoulder. (Note that a H&S pattern normally takes 3 to 9 months to evolve.)
Also, the SPX is still forming a rising wedge. The small H&S’s neckline could serve as the larger H&S neckline. Finally, a fall below that may demonstrate that such a wedge breakout would be for real.
So why do we continue entertaining these pessimistic ideas—aside from the horrible data and macroeconomic risks? We can't help but be influenced by the persistently low Advance / Decline Line. This signals that the index acceleration we're seeing isn't equally represented across market breadth.
After a short spike nearly two weeks ago, the Advance / Decline line demonstrates that the broader market returned to the depressed levels seen since the initial dead-cat bounce back in late March.
Having pointed out this significant piece of negative technical information, we have to ask bullish investors: is this stock market advance sustainable? And are investors right to expect a V-shaped recovery? Is it worthwhile taking for granted that the government will deliver the fiscal package the Fed warned is necessary to help the country snap out of a prolonged, painful economic slump? And is it rational to expect that QE can replace a real economy and prop up stocks for the long run?
And we haven't even started talking about a potential cold war between the world’s two largest economies yet. That grim development hasn't cast a shadow on investors’ sunny optimism either. Clearly, investors are counting on more room for stocks to rise according to the ratio between liquidity and price.
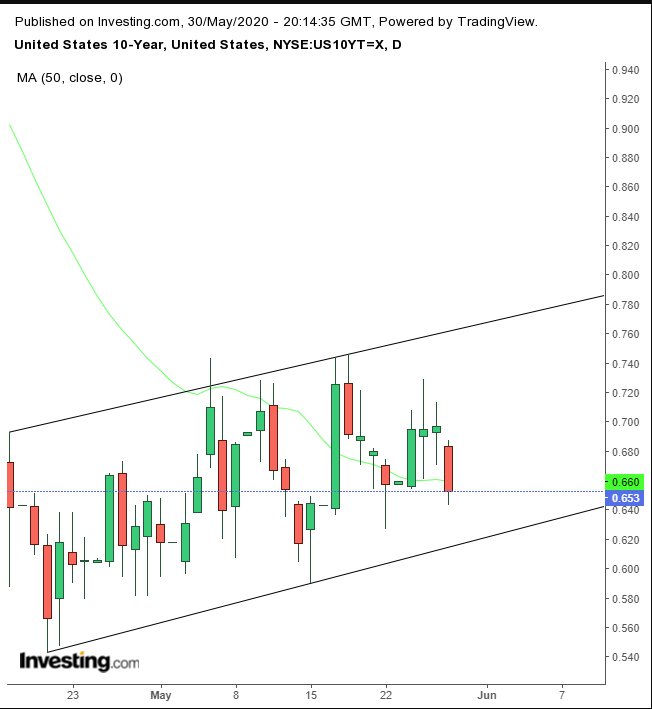
Yields, including for the 10-year Treasury benchmark, fell to a two-week low on Friday, demonstrating increased demand for Treasurys, even while stocks advanced.
From a technical perspective, however, rates may have found support at last week’s hammer within a rising channel.
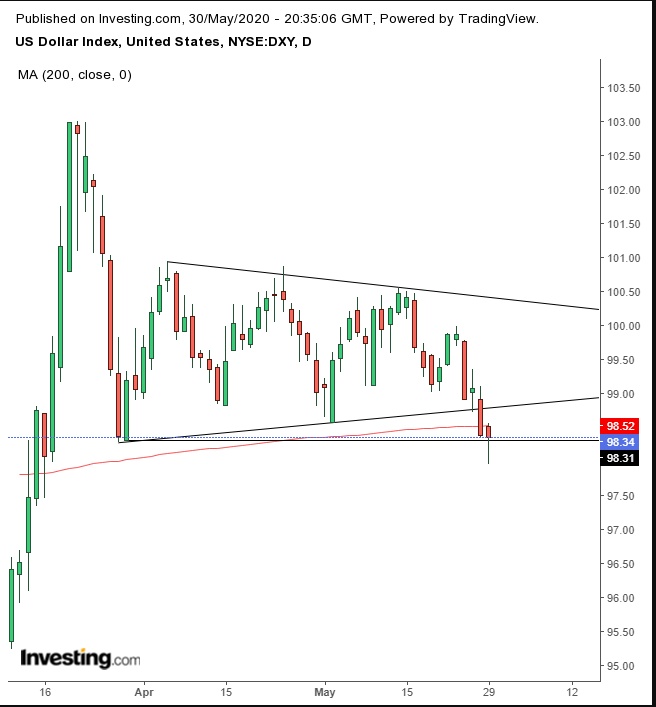
The dollar fell for a second day as the trading week drew to a close, breaking through the floor of a range that we found perplexing.
It seems the downside breakout followed the last move before the congestion, a 4.5% drop within the six days before the symmetrical triangle. While the price did provide a downside breakout, with a close below the 200 DMA to boot, note that the hammer’s close was above the March 27 lows, which started the pattern. This may signal a return move.
The dollar weakness boosted gold.
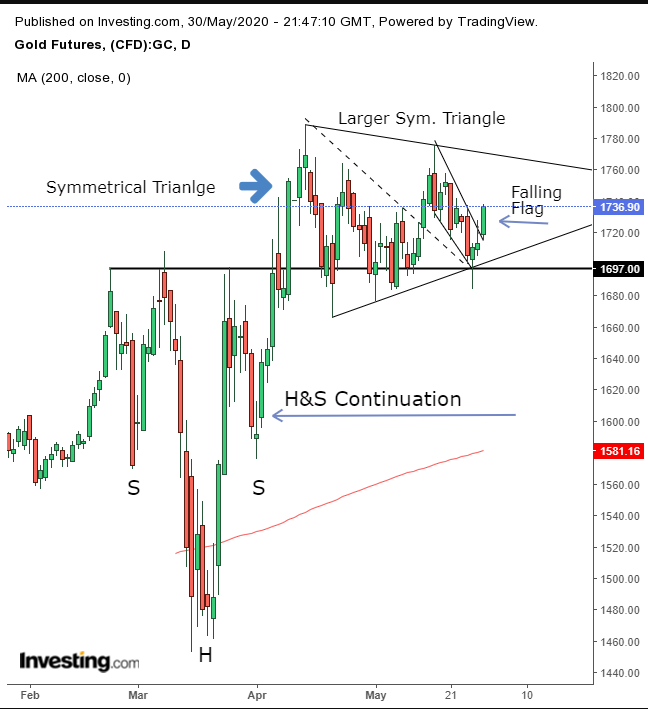
The precious metal was released from a possible falling flag, completing a return move to both the preceding symmetrical triangle and an even earlier H&S continuation pattern as it enlarges the symmetrical triangle.
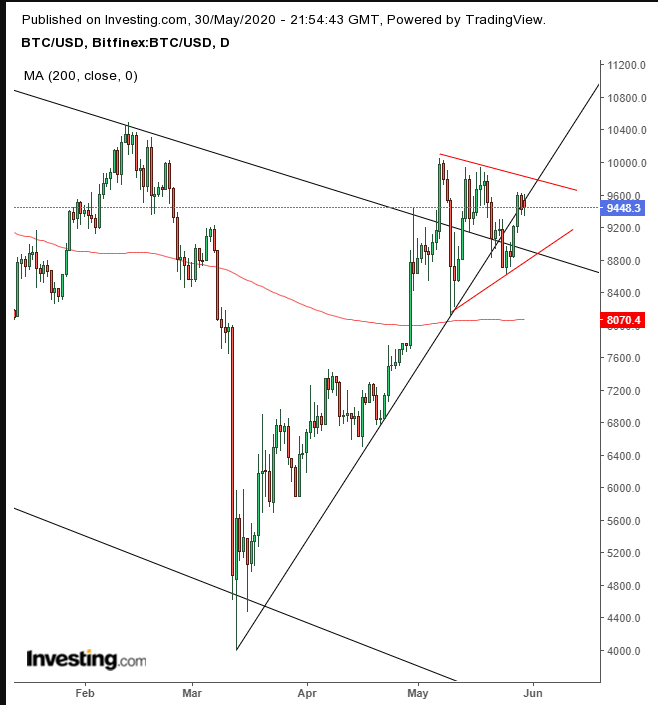
Bitcoin gained for the week.
The crypto currency rose within a symmetrical triangle, as it struggles to break free of the long-term downtrend since the June high. The continuation pattern is supported by the 200 DMA, making the case that the uptrend since the March low will have the last word.
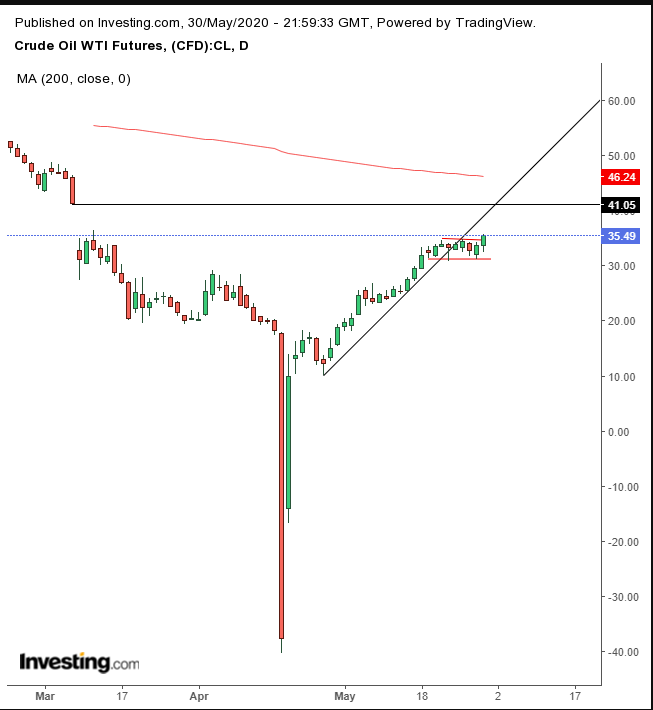
Crude oil rallied late and posted its biggest monthly advance on record.
The commodity finishing halfway through to $36 a barrel, for the first time since March 6. The top of the falling gap posted on March 9 is a presumed resistance, at $41. Meanwhile, Friday’s advance may be the completion of a flag, though we would have considered it a more potent signal had the range tilted downward. That would have strengthened the scenario that all the supply has been exhausted.
Week Ahead
All times listed are EDT
Sunday
21:45: China – Caixin Manufacturing PMI: seen to remain flat at 49.6.
Monday
Germany, Switzerland, and New Zealand markets closed for holidays
3:55: Germany – Manufacturing PMI: likely to be 36.8 from 36.8.
4:30: UK – GDP: expected to edge up to 40.7 from 40.6.
10:00: US – ISM Manufacturing PMI: likely to rise to 43.0 from 41.5.
Tuesday
00:30: Australia – RBA Interest Rate Decision: the central bank down under is expected to hold rates steady at 0.25%.
21:30: Australia – GDP: anticipated to fall to -0.3 from 0.5% QoQ.
Wednesday
3:55: Germany – Unemployment Change: forecast to fall to 195K from 373K.
4:30: UK – Services PMI: expected to edge higher to 28.0 from 27.8.
8:15: US – ADP Nonfarm Employment Change: predicted to fall to -9,000k from -20,236K.
10:00: US – ISM Non-Manufacturing PMI: likely to climb to 44.0 from 41.8.
10:00: Canada – BoC Interest Rate Decision: forecast to remain steady at 0.25%.
10:30: US – Crude Oil Inventories: expected to drop to -1.944M from 7.928M.
21:30: Australia – Retail Sales: seen to plunge to -17.9% from 8.5%.
Thursday
4:30: UK – Construction PMI: anticipated to surge to 30.0 from 8.2.
7:45: Eurozone – ECB Monetary Policy Statement and Interest Rate Decision: rate forecast to remain flat at 0%.
Friday
8:30: US – Nonfarm Payrolls: expected to come in at -8,250K for May from -20,500K in April.
8:30: Canada – Employment Change: likely to have dropped to -500.0K in May from -1,993.98K in April.
Related Articles

The combination of extremely rich equity valuations, high interest rates, and a new President taking bold actions will likely continue to whip stocks around for the foreseeable...

A couple of weeks ago, I presented a blog post called “Trump Era Volatility: The Impact on Portfolio Allocations,” in which I pointed out that the effect of increasing volatility...

Just recently, S&P Global released its 2026 earnings estimates, which, for lack of a better word, have gone parabolic. Such should not be surprising given the ongoing...
Are you sure you want to block %USER_NAME%?
By doing so, you and %USER_NAME% will not be able to see any of each other's Investing.com's posts.
%USER_NAME% was successfully added to your Block List
Since you’ve just unblocked this person, you must wait 48 hours before renewing the block.
I feel that this comment is:
Thank You!
Your report has been sent to our moderators for review



Add a Comment
We encourage you to use comments to engage with users, share your perspective and ask questions of authors and each other. However, in order to maintain the high level of discourse we’ve all come to value and expect, please keep the following criteria in mind:
Perpetrators of spam or abuse will be deleted from the site and prohibited from future registration at Investing.com’s discretion.