Many investors look for anomalies or systematic patterns—often described as influences due to seasonality—to beat the market. One of these is the January effect which suggests that returns, especially in small-cap stocks, during the first month of the new year, are statistically larger than during other months.
Seminal research by Rozeff and Kinney (1976), which looks at prices of companies listed on the New York Stock Exchange, highlighted that in most years between 1904-74, over one-third of the annual returns came in January alone.
Since then, both academics and practitioners who have continued similar studies have suggested various explanations for the January effect: end-of-year tax considerations by market participants that lead to rotations and portfolio rebalancing mostly by fund managers. Others have argued that this seasonal effect has evolved and now possibly starts earlier, in December.
Making forecasts about what January 2021 may bring for equity investors, especially after a roller-coaster year like 2020, is no small feat. However, those investors who believe this seasonal pattern could hold true in 2021 too, may want to research small-cap shares and exchange-traded funds (ETFs) further.
We previously discussed small-caps and introduced funds that focus both on US shares}} as well as {{art-200544982||global companies. Today's article extends the discussion to two funds that could benefit from the further rotation out of large-caps into small-caps.
However, we have to point out that the definition of a small-cap can easily differ between brokers as well as countries. Also, many ETFs whose names suggest a focus on small-caps, in fact, include mid-cap businesses, too.
With that information in mind, here are today’s two ETFs:
1. Vanguard S&P Small-Cap 600 Growth ETF
- Current price: $198.52
- 52-week range: $99.36 - $199.38
- Dividend Yield: 0.65%
- Expense ratio: 0.15%
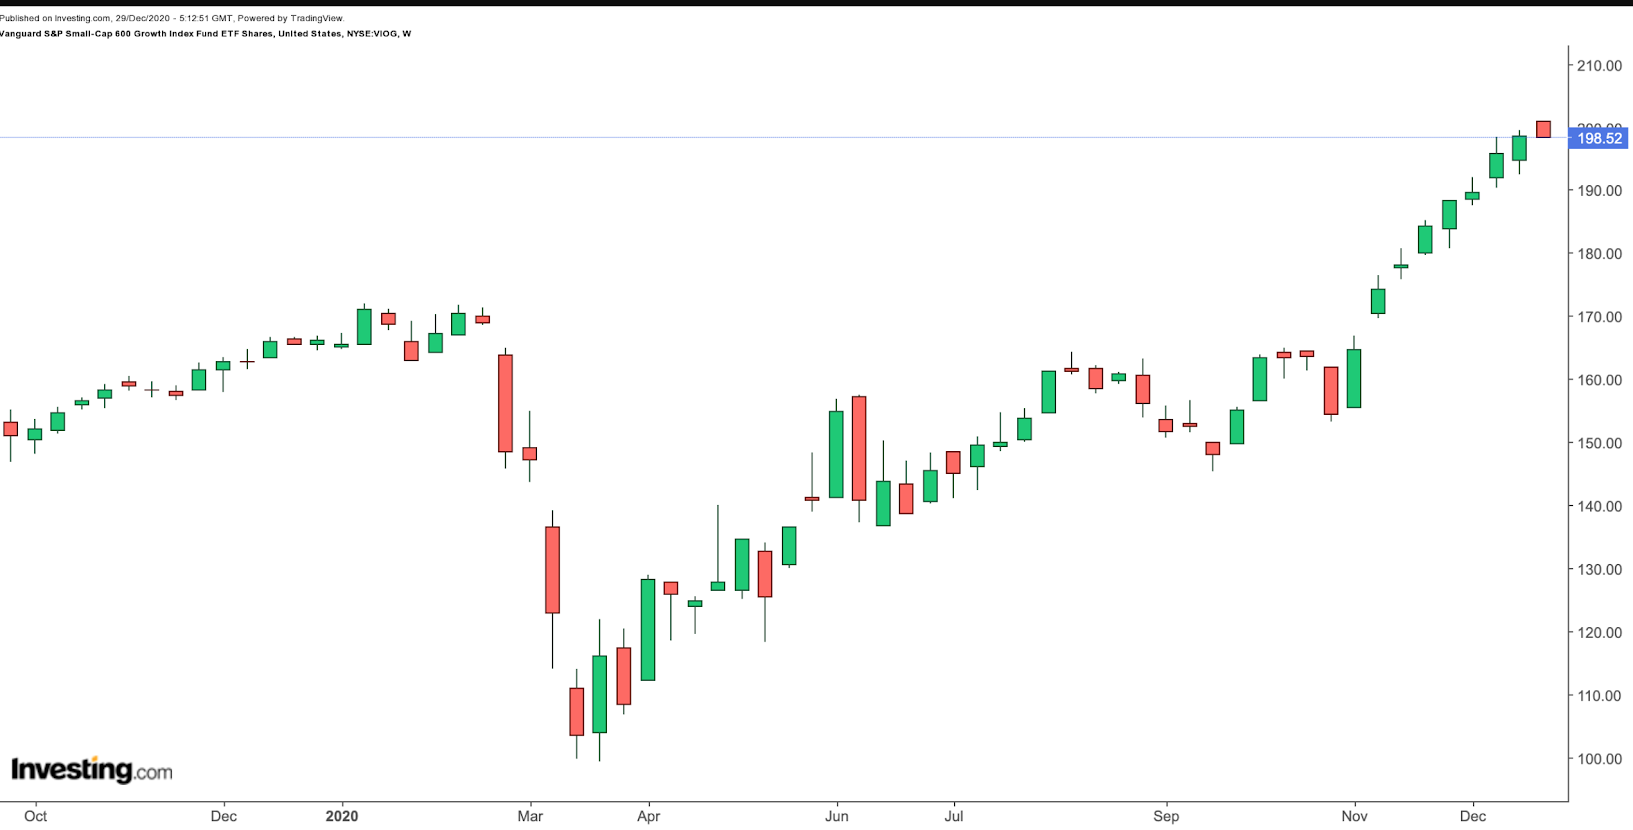
The Vanguard S&P Small-Cap 600 Growth ETF (NYSE:VIOG) invests in a range of growth stocks found in the S&P SmallCap 600 index. The fund started trading in Sept. 2010 and currently has $358 million under management.

VIOG, which has 343 holdings, tracks the returns of the S&P Small-Cap 600 Growth Index. In terms of sectoral weighting, information technology (IT) has the highest allocation with 22.00%, followed by industrials (18.80%), consumer discretionary (13.50%), health care (13.30%), and financials 12%.
Automation, vacuum, and instrumentation solutions provider Brooks Automation (NASDAQ:BRKS), cancer genetics diagnostic testing specialist NeoGenomics (NASDAQ:NEO), insurance group Kinsale Capital (NASDAQ:KNSL), outdoor leisure product manufacturer Yeti (NYSE:YETI) and trucking company Saia (NASDAQ:SAIA) lead the fund. 10.8% of the fund’s assets are in the top ten businesses.
Year-to-date (YTD), VIOG has returned close to 20%. However, it’d be important to note that the fund ended October at $154.31 (or about 7% down for the year). Then a fast run-up occurred in the past eight weeks to take us to a YTD return of 20%. Put another way, the proverbial $1,000 invested in the ETF on Oct. 30 would now be well over $1,250.
Potential investors who follow various fundamental and technical indicators may be wondering if many of the names in the ETF have become frothy. The trailing P/E and P/B ratios are 25.4 and 2.7, respectively.
We’d argue that the January effect might have already started earlier in a number of the stocks in the fund. Therefore, short-term profit-taking could put pressure on the fund soon. A potential decline toward $185 would improve the margin of safety.
2. Invesco S&P SmallCap Financials ETF
- Current Price: $49.12
- 52-Week Range: $29.46 - $57.32
- Dividend Yield: 3.58%
- Expense Ratio: 0.29%
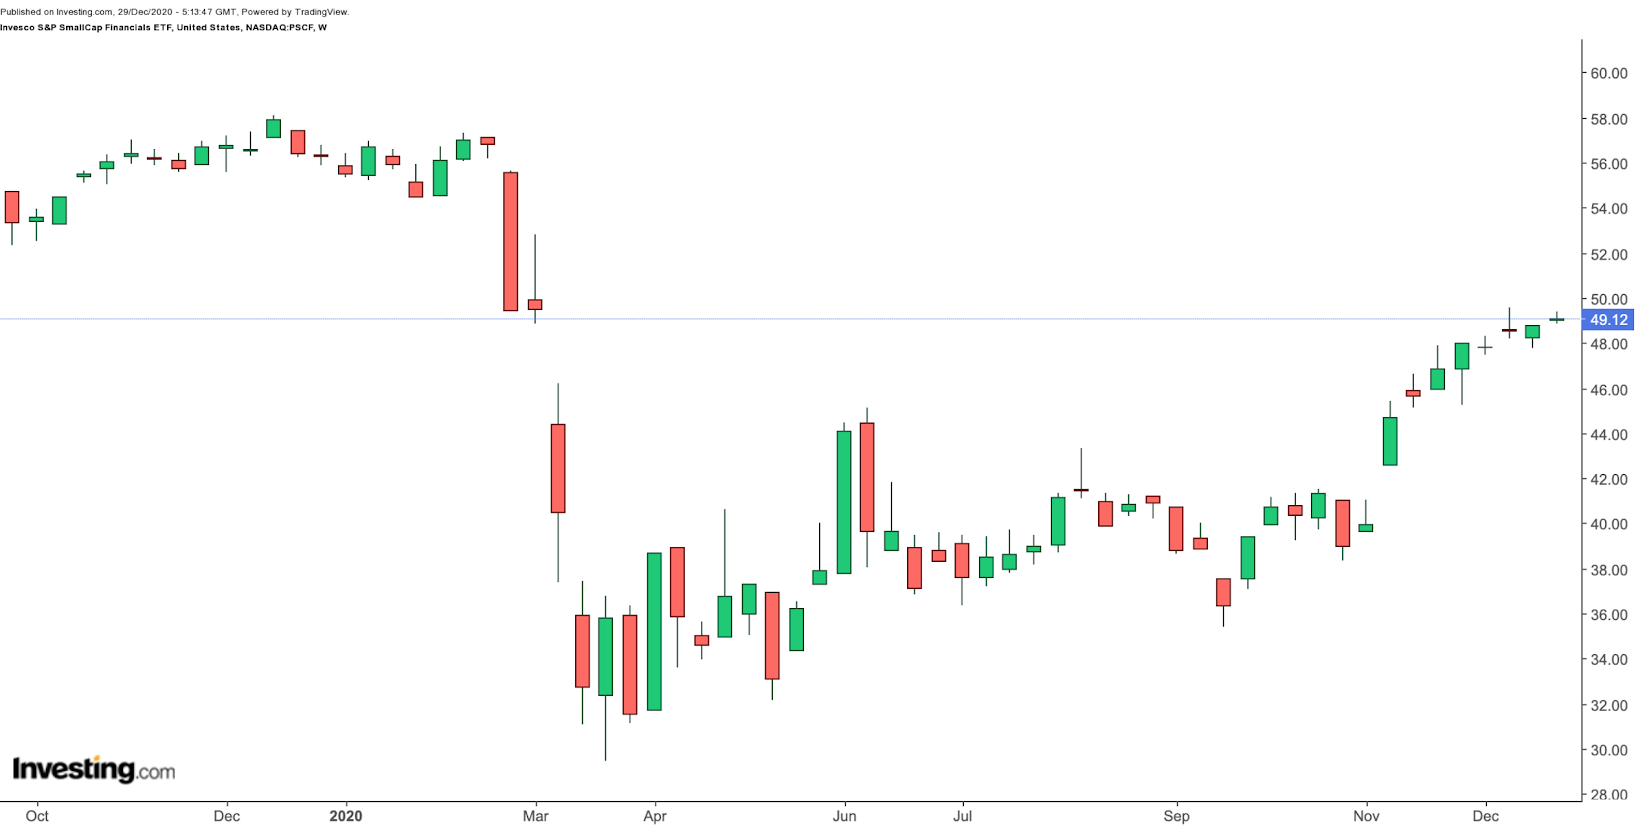
The Invesco S&P SmallCap Financials ETF (NASDAQ:PSCF) invests in a range of small-cap US financial services firms that offer products and services in banking, investment management, insurance and real estate finance.

PSCF, which tracks the S&P SmallCap 600 Capped Financials and Real Estate Index, has 598 holdings. The fund started trading in April 2010, However, it is still a small ETF as assets under management stand at about $27 million.
Top names in the ETF include Kinsale Capital, real estate investment trusts (REITs) Innovative Industrial Properties (NYSE:IIPR) and Agree Realty (NYSE:ADC), pet insurance provider Trupanion (NASDAQ:TRUP) and Community Bank System (NYSE:CBU), which offers banking and employee benefit services.
Year-to-date, PSCF is down 14%. The forward P/E and P/B ratios stand at 18.07 and 1.09. Those investors looking to diversify into small-caps with a focus on financials may consider including the fund in their portfolios. We’d ideally look to buy around $45.
Reference:
Rozeff, Michael S. & Kinney, William Jr., 1976. "Capital market seasonality: The case of stock returns," Journal of Financial Economics, Elsevier, vol. 3(4), pages 379-402, October.
