- The US Fed's signal of potential rate cuts next year weakened the US dollar, which closed the week in the 102 band.
- Despite the dollar's decline, expectations for a rate cut in March, currently at 80%, are keeping the dollar under pressure.
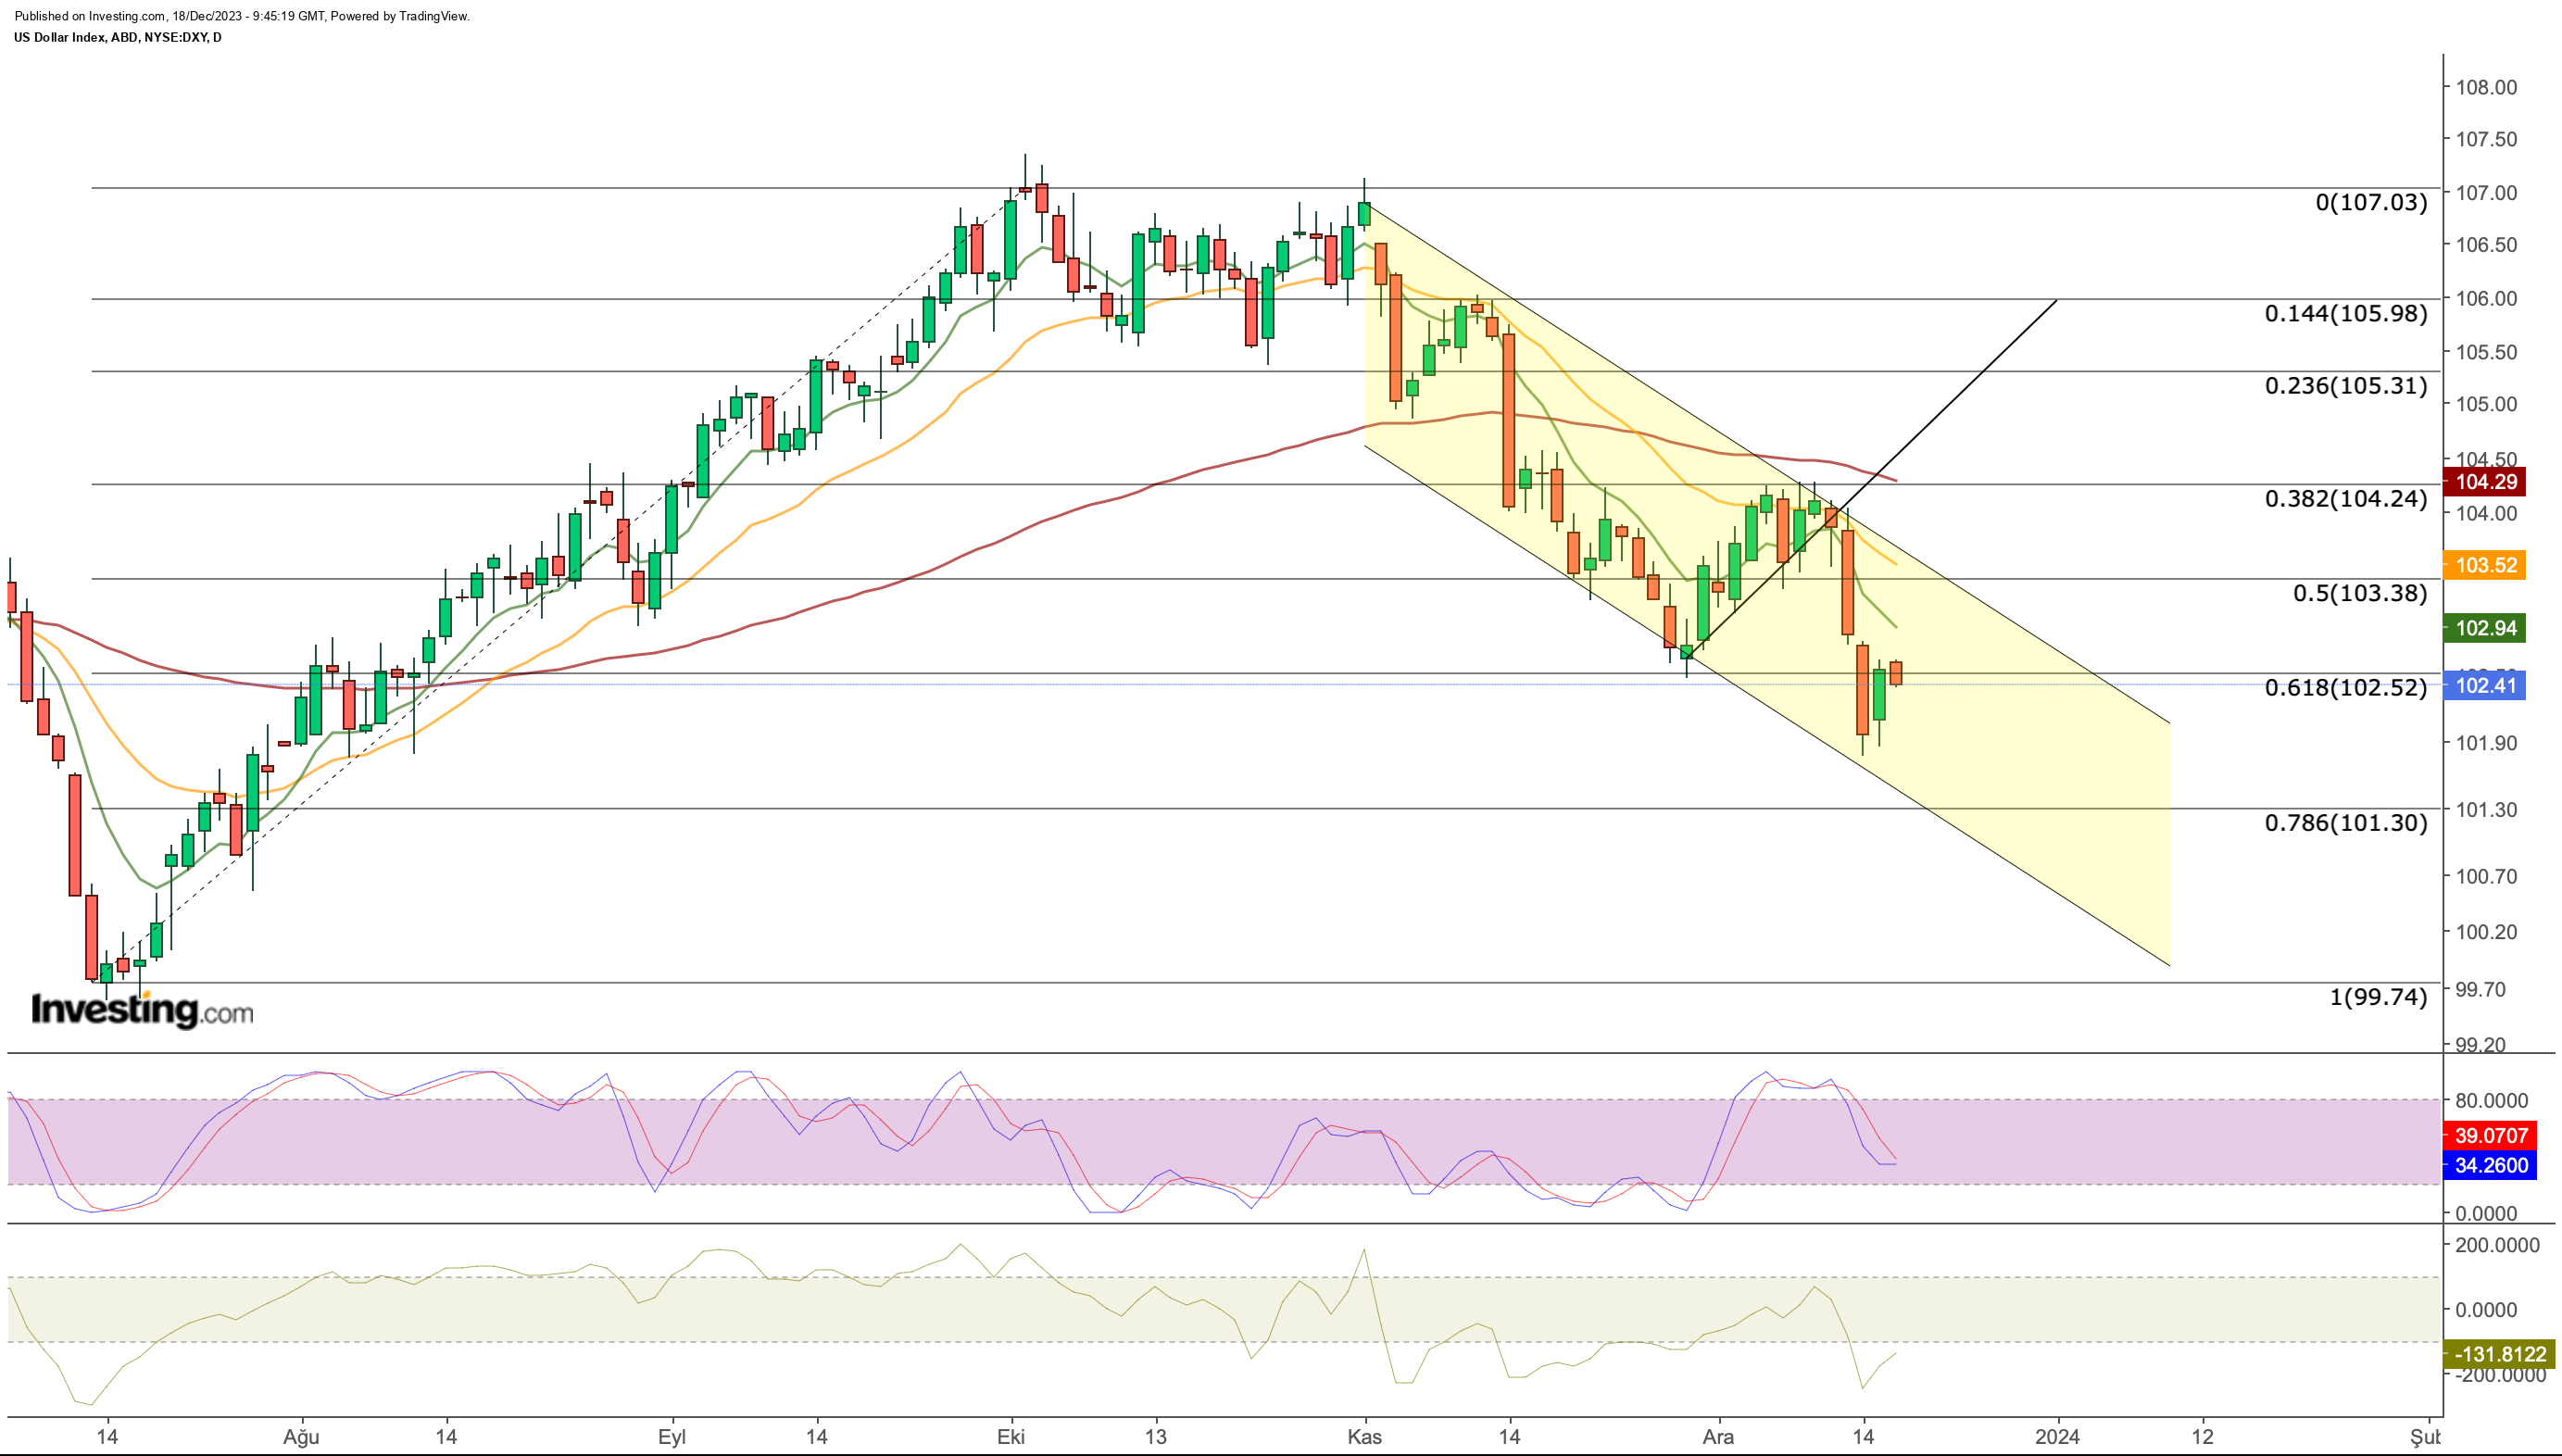
- The technical outlook for the US dollar index (DXY) suggests a potential reversal, with critical levels at 102.5 and resistance at 103.
After keeping interest rates unchanged last week, the US Fed signaled its intention to begin reducing interest rates next year.
The US dollar index, declining in response to the Fed's statement, sustained its weakened stance by closing the week in the 102 bands, having dropped below the 102 level the previous week.
DXY, hitting its lowest point in the last 4 months last week, further intensified its decline as the European Central Bank and the Bank of England provided more hesitant signals regarding interest rate cuts.
While the current outlook suggests that the dollar may move sellers against major currencies until the end of the year, weak global growth may be a trigger for the dollar to find support at current levels in the first quarter of 2024.
However, in the current situation, while surveys show that the expectation for a rate cut in March has reached 80%, this expectation continues to keep the dollar under pressure.
On the other hand, Atlanta Fed President Bostic said that rate cuts could start in the 3rd quarter, provided that the bank inflation does not derail, in his opinion on the Fed's monetary policy. Bostic expects 2 quarterly rate cuts next year.
Chicago Fed President Austan Goolsbee argued in his latest statement that the focus should be on inflation employment as it moves towards its target.
According to this statement, Goolsbee was one of the Fed members who remained more optimistic that restrictive monetary policy could be abandoned earlier.
According to the current outlook, the weakening of the dollar can be expected to continue partially until the end of the year.
With the new year, we may see that the decline will not continue for a long time with some recovery based on the global outlook. Accordingly, let's check the critical levels for the dollar index in technical terms.
DXY encountered resistance at 104 last week, realized a breakout, and ended the partial recovery in the first half of December.
Although last week's downward momentum dipped below the critical support at 102.5 (Fib 0.618), the index seems to have maintained this support with a quick recovery.
In this week's trading, we may see that DXY may signal a reversal on daily closes above 102.5.
However, the technical outlook shows that the support is not solid. The downward trend of the short-term EMA values and the negative outlook of the Stochastic RSI despite Friday's purchases signal that the DXY may fall as low as 101.3 on daily closes below 102.5.
On the other hand, the 103 band has become important due to the falling channel movement in a possible recovery move this week. After a recovery to this level, DXY may take another swing towards 101 support.
EUR/USD Looks to Turn Resistance Into Support
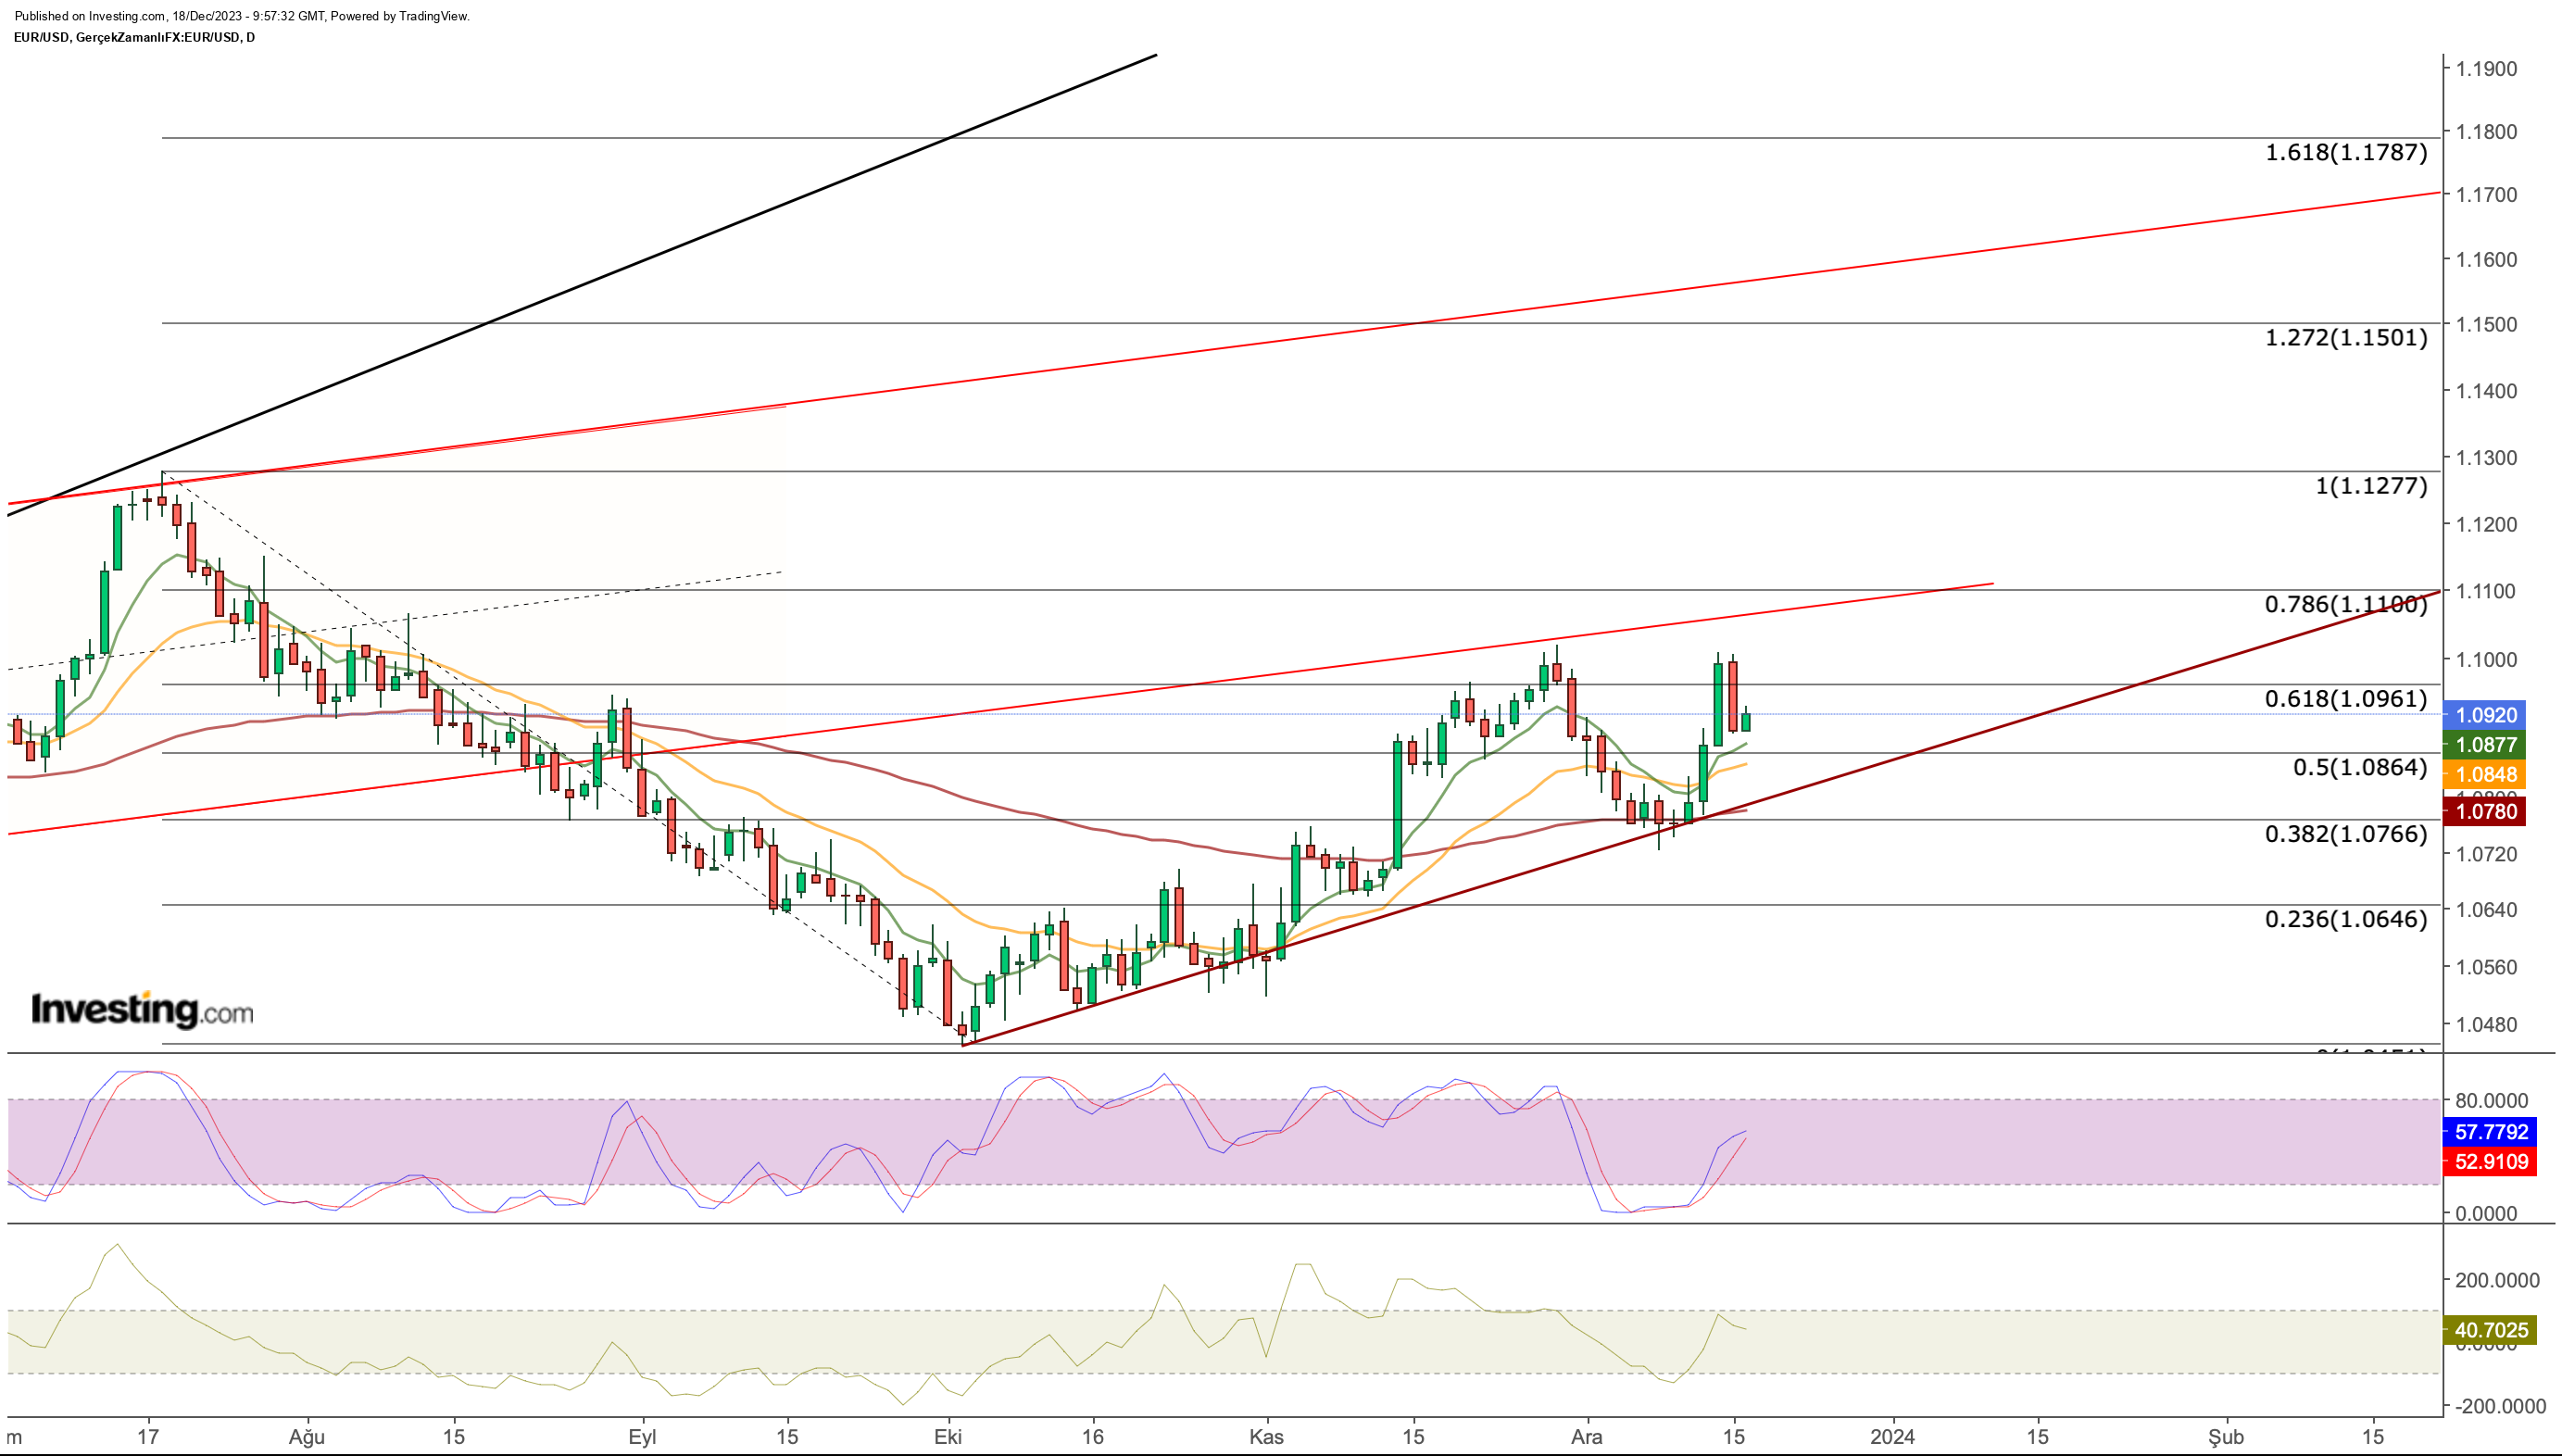
EUR/USD retested the November resistance of 1.096 in last week's upward move.

Rejected once again at this point, the pair has not yet moved away from the resistance zone. If EUR/USD closes a clear daily candle in the 1.1 bands in intra-week trading, it may turn the current resistance zone into support.
In this case, the next target for the euro will be followed as 1.11 dollars. The continuation of the movement will allow the EUR/USD parity to re-enter the 2023 bullish channel and at this point, 1.128 - 1.15 and then 1.17 levels can be followed as new targets.
However, according to the current outlook, 1.11 resistance may appear as a harder obstacle. A return from this region could push the pair back to 1.08 in the first month of 2024.
Gold Looks to Hold Support
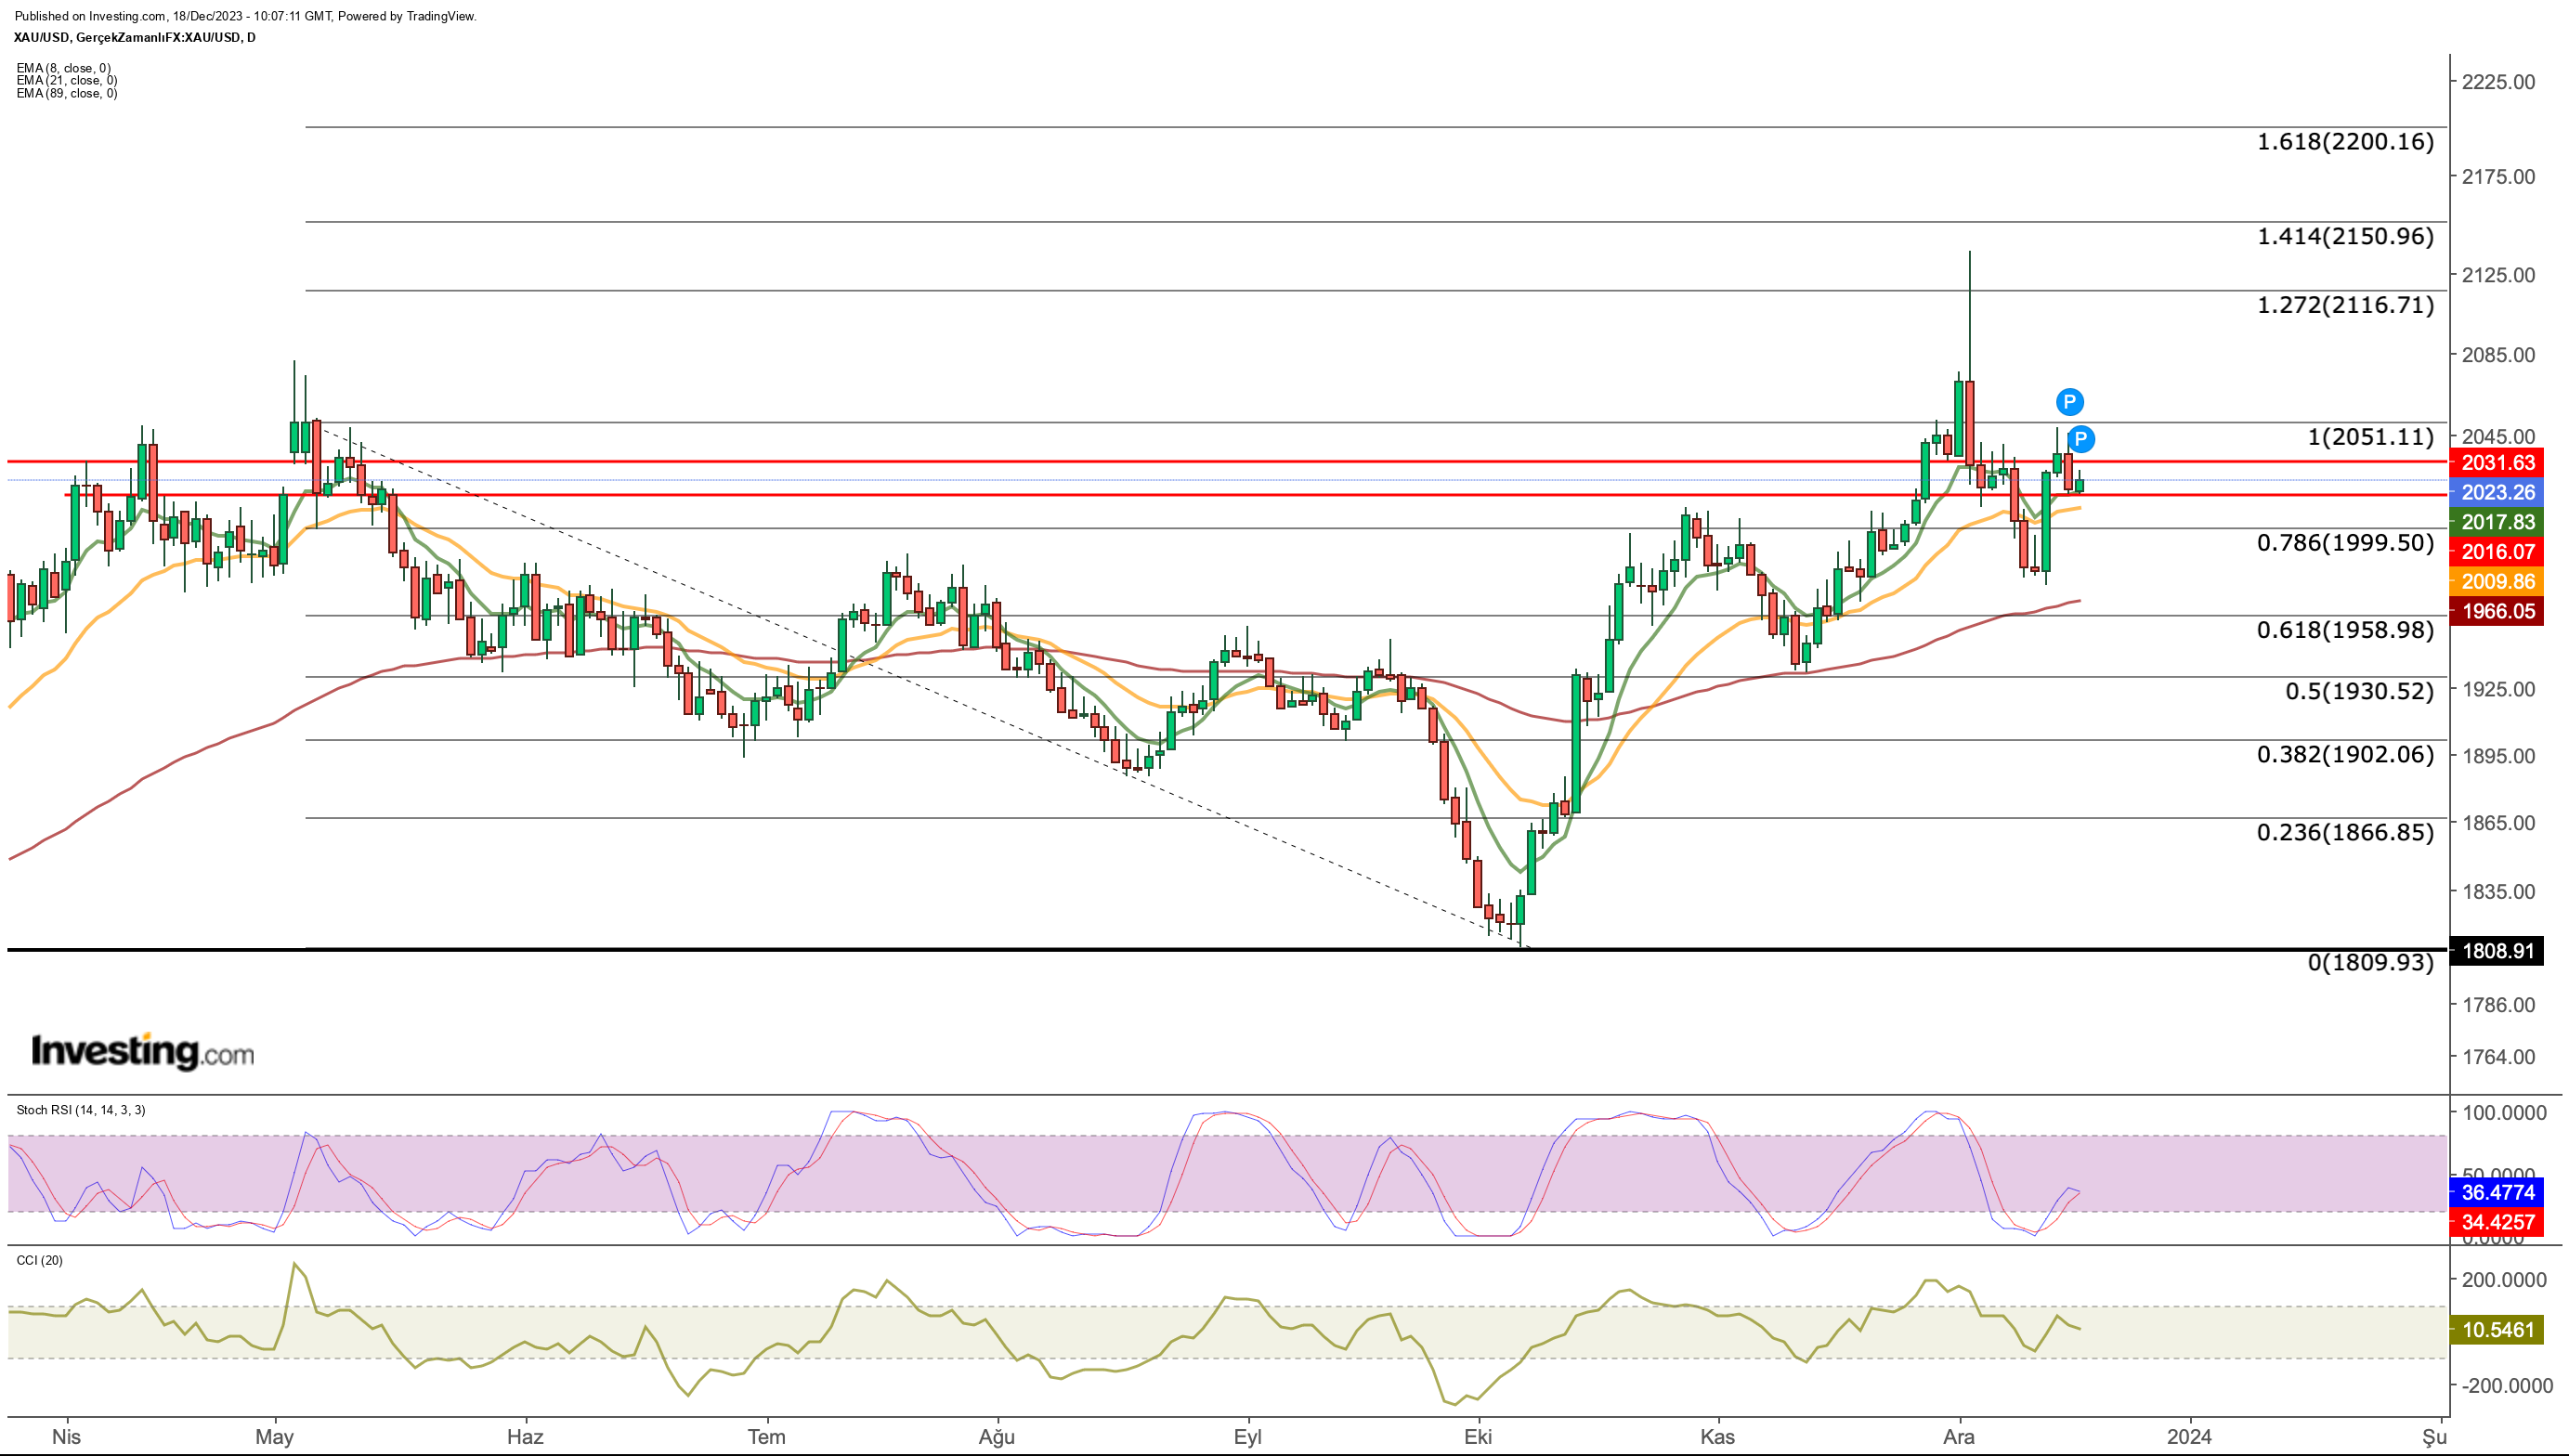
Gold, which was supported in the $ 1,970 band last week, once again tested its resistance at $ 2,030 in the first days of December. Gold investors, who have difficulty breaking this level, continue to support the asset in the $ 2,015 region.
If gold, which maintains its upward movement, technically performs a weekly closing above $ 2,050, we can see that it can make a new rally towards the $ 2,150 - $ 2,200 range, exceeding the record level it has set in recent days.
However, failure to exceed the resistance line extending up to $ 2,050 will bring selling pressure, and this time in the bearish scenario, the possibility of gold retreating to the $ 1,930 - $ 1,960 area will increase.
***
You can easily determine whether a company is suitable for your risk profile by conducting a detailed fundamental analysis on InvestingPro according to your criteria. This way, you will get highly professional help in shaping your portfolio.
In addition, you can sign up for InvestingPro, one of the most comprehensive platforms in the market for portfolio management and fundamental analysis, much cheaper with the biggest discount of the year (up to 60%), by taking advantage of our extended Cyber Monday deal.
Disclaimer: This article is written for informational purposes only; it does not constitute a solicitation, offer, advice, or recommendation to invest as such it is not intended to incentivize the purchase of assets in any way. I would like to remind you that any type of asset, is evaluated from multiple points of view and is highly risky and therefore, any investment decision and the associated risk remains with the investor.

