- Conducting technical analysis is just one side of the equation when analyzing stocks.
- However, an in-depth fundamental analysis can be even more crucial before deciding whether to buy a stock.
- This is where InvestingPro comes in, with its advanced tools and a sea of data available, you can analyze a company's fundamentals like never before.
- And now, you can secure your Black Friday gains with InvestingPro's up to 55% discount!
Investing in the stocks requires more in-depth research compared to other investment instruments. Stock investment implies becoming a shareholder in a company, making it crucial to understand the financial health of the chosen company, how its stock price has performed, and its behavior in relation to the industry and market conditions.
InvestingPro, as a platform, provides all the tools for conducting a detailed fundamental analysis of a company, allowing you to research like a professional investor on a single screen. The InvestingPro platform not only offers detailed company stock analysis but also provides a rich set of data for creating a portfolio based on your own criteria through filtering methods.
Now, let's explore how InvestingPro can be effectively utilized using Tesla (NASDAQ:TSLA) stock as an example. When you switch to InvestingPro from the Investing.com main site, you can quickly access company-specific data by typing the name of the company you want from the company search tab in the upper left corner.
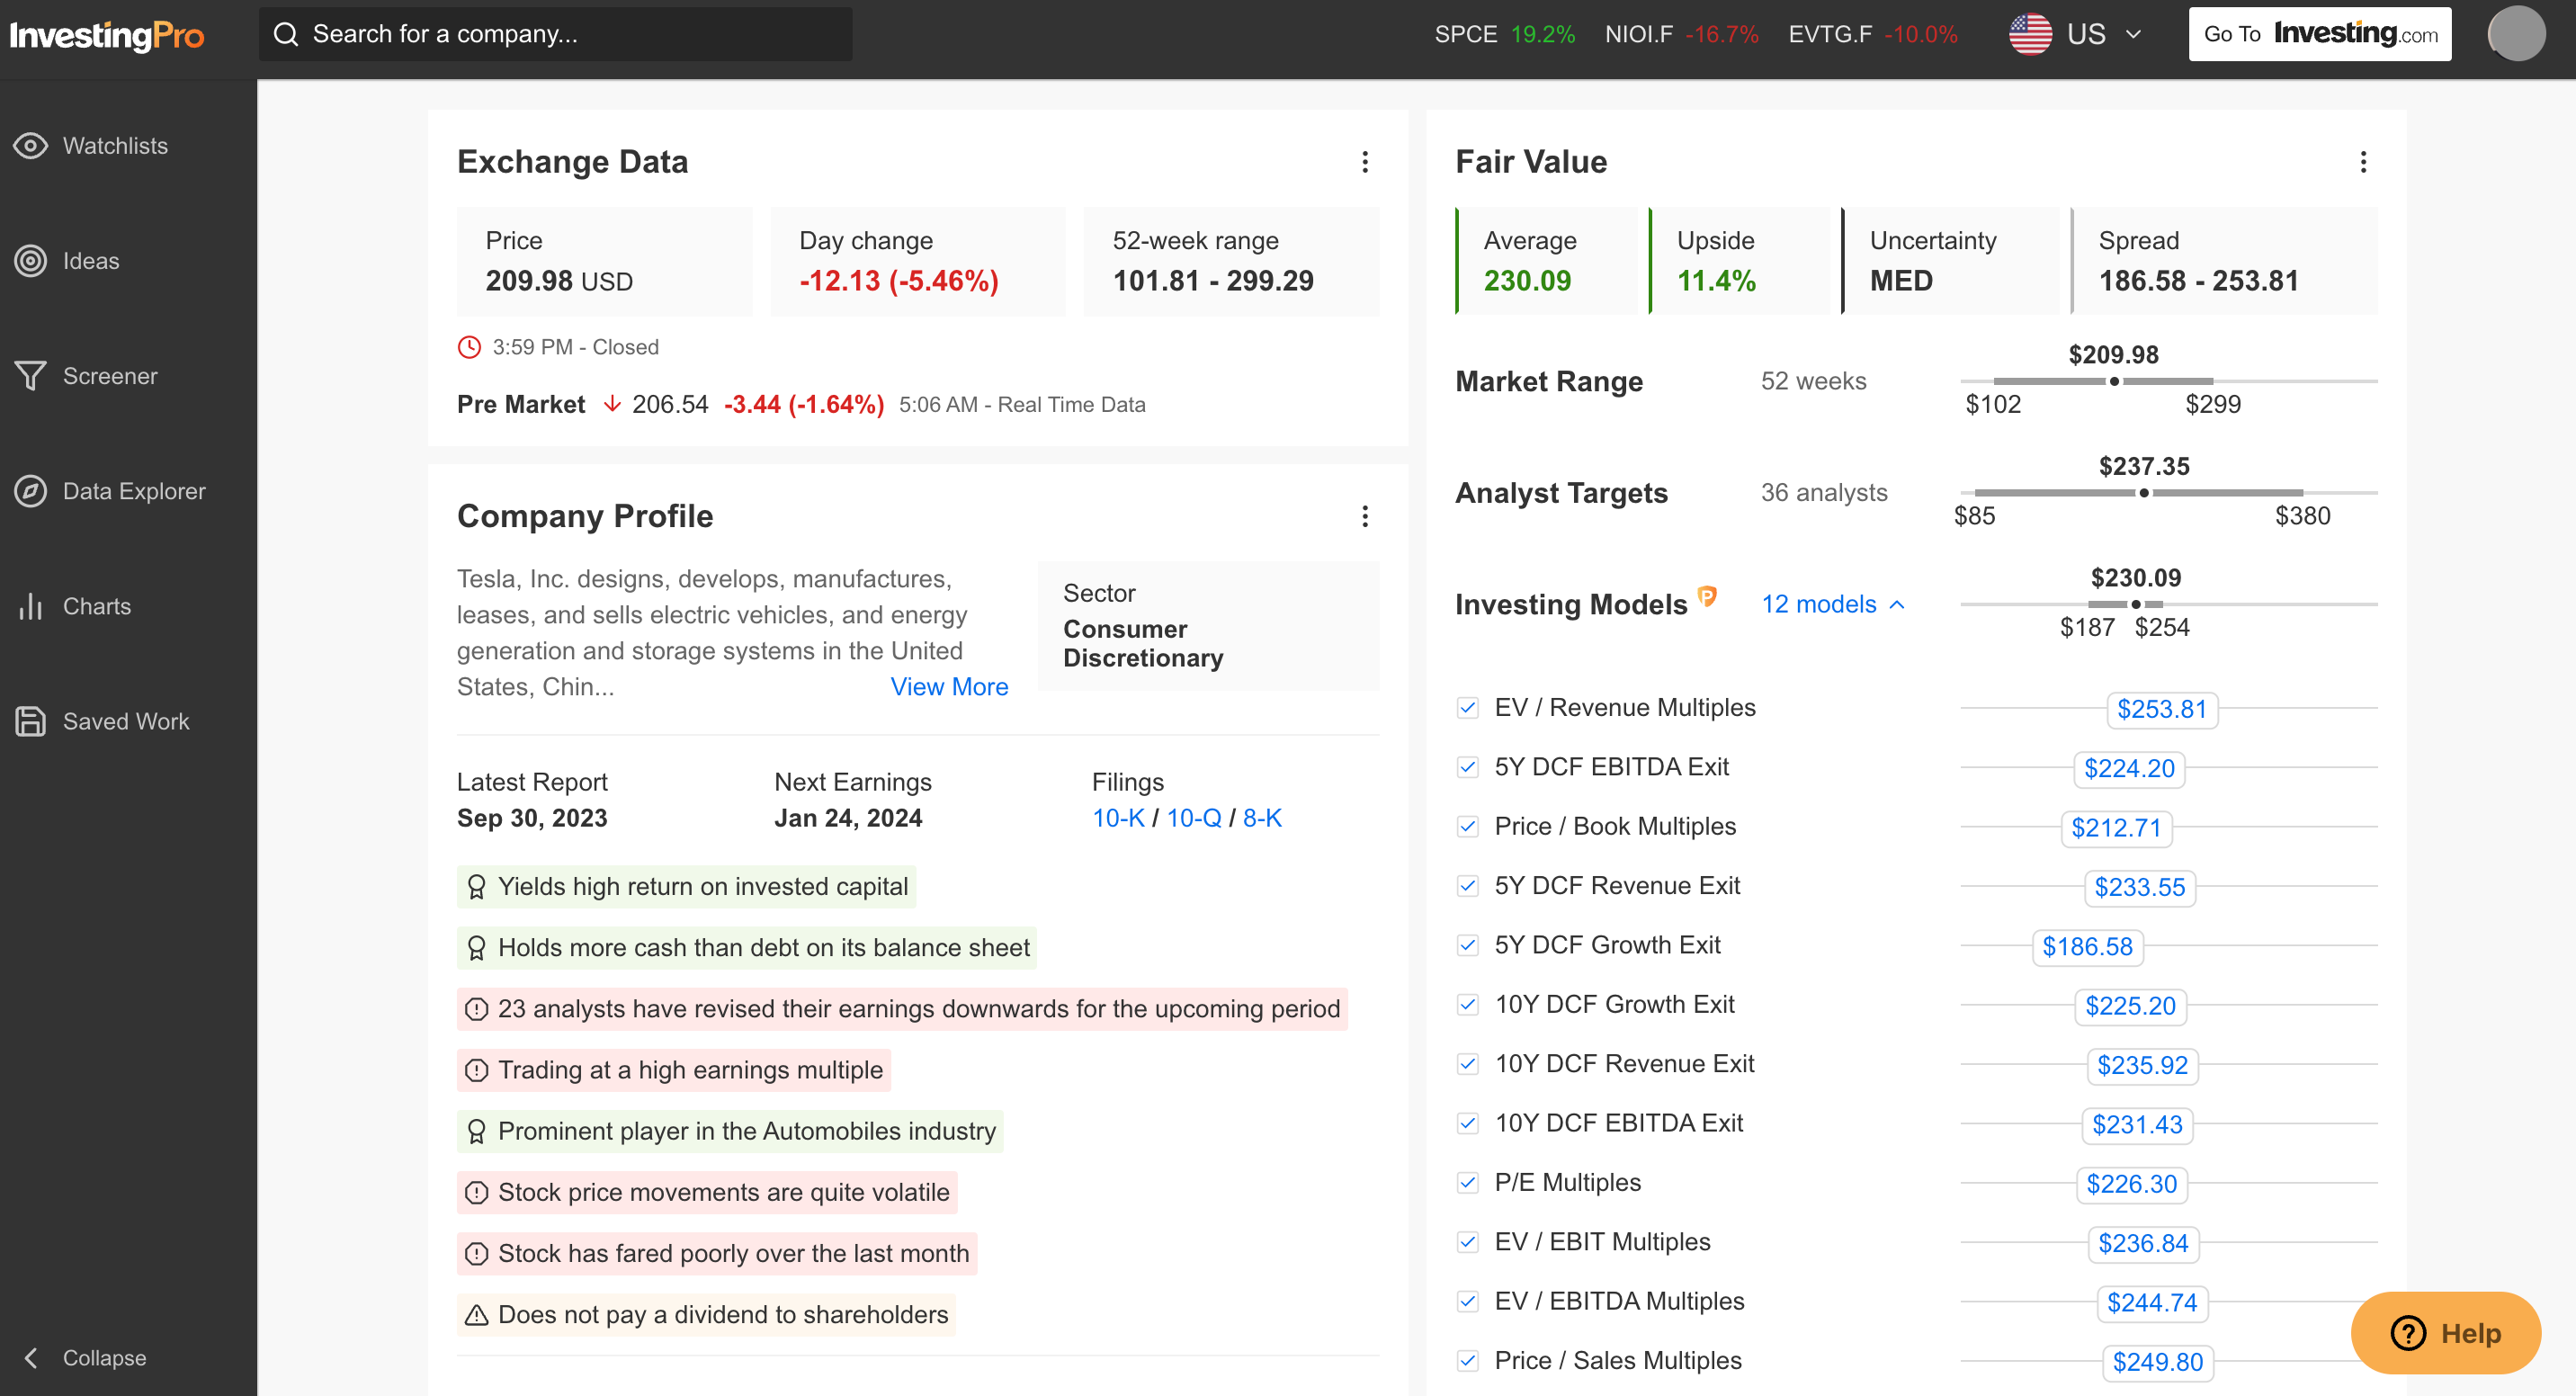
Designed in a highly user-friendly manner, the home tab of a stock provides summary information about the company, giving you a quick overview. Among these details, you can see the current stock price, along with a detailed fair value analysis within the last year's price range.
Home Tab: An Overview of the Stock's Fundamentals
As seen in the example below, Tesla's fair value analysis, calculated based on 12 financial models, suggests a potential rise of 11%, reaching $230 within a one-year period. Additionally, professional analysts' average price targets are presented as an alternative.
Source: InvestingPro
As a reminder, InvestingPro supports 24 languages, allowing you to conduct your analysis in your own language and in the currency of your choice.
On the rest of the home page, you can find a summary of current information about the company's financial situation. In addition, cash flow, growth, profitability, profitability, price momentum, and relative value, which are the most important criteria for a company, are scored out of 5, providing you with practical information about the financial health of the company. 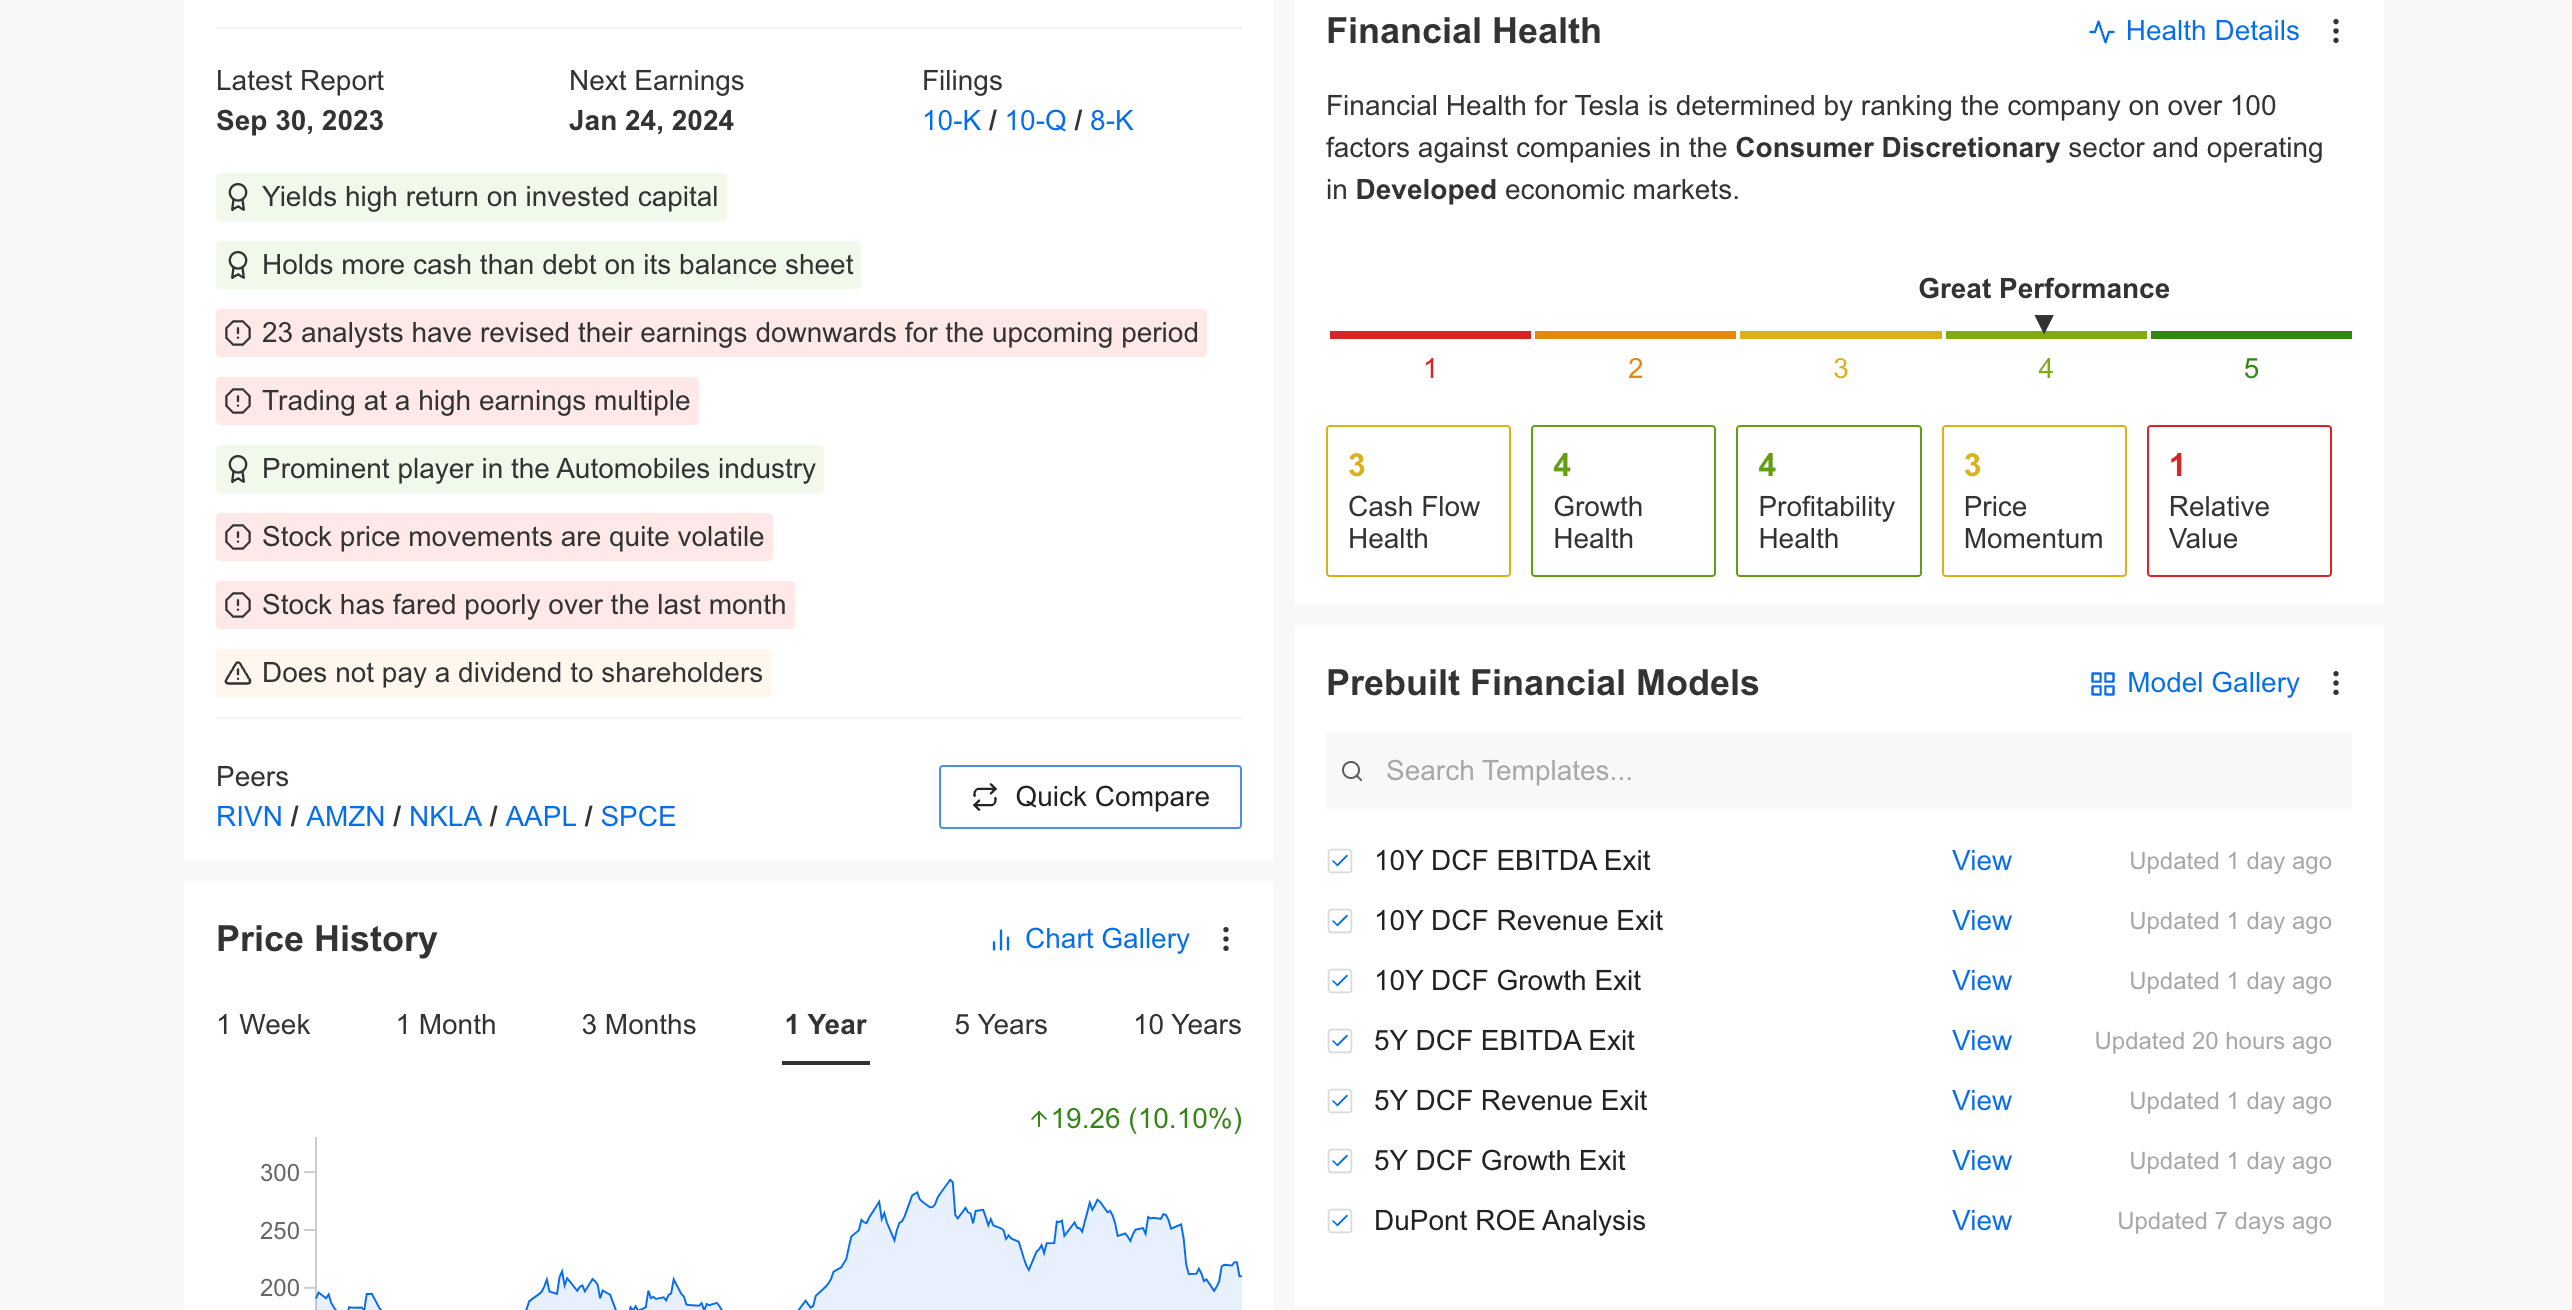
Source: InvestingPro
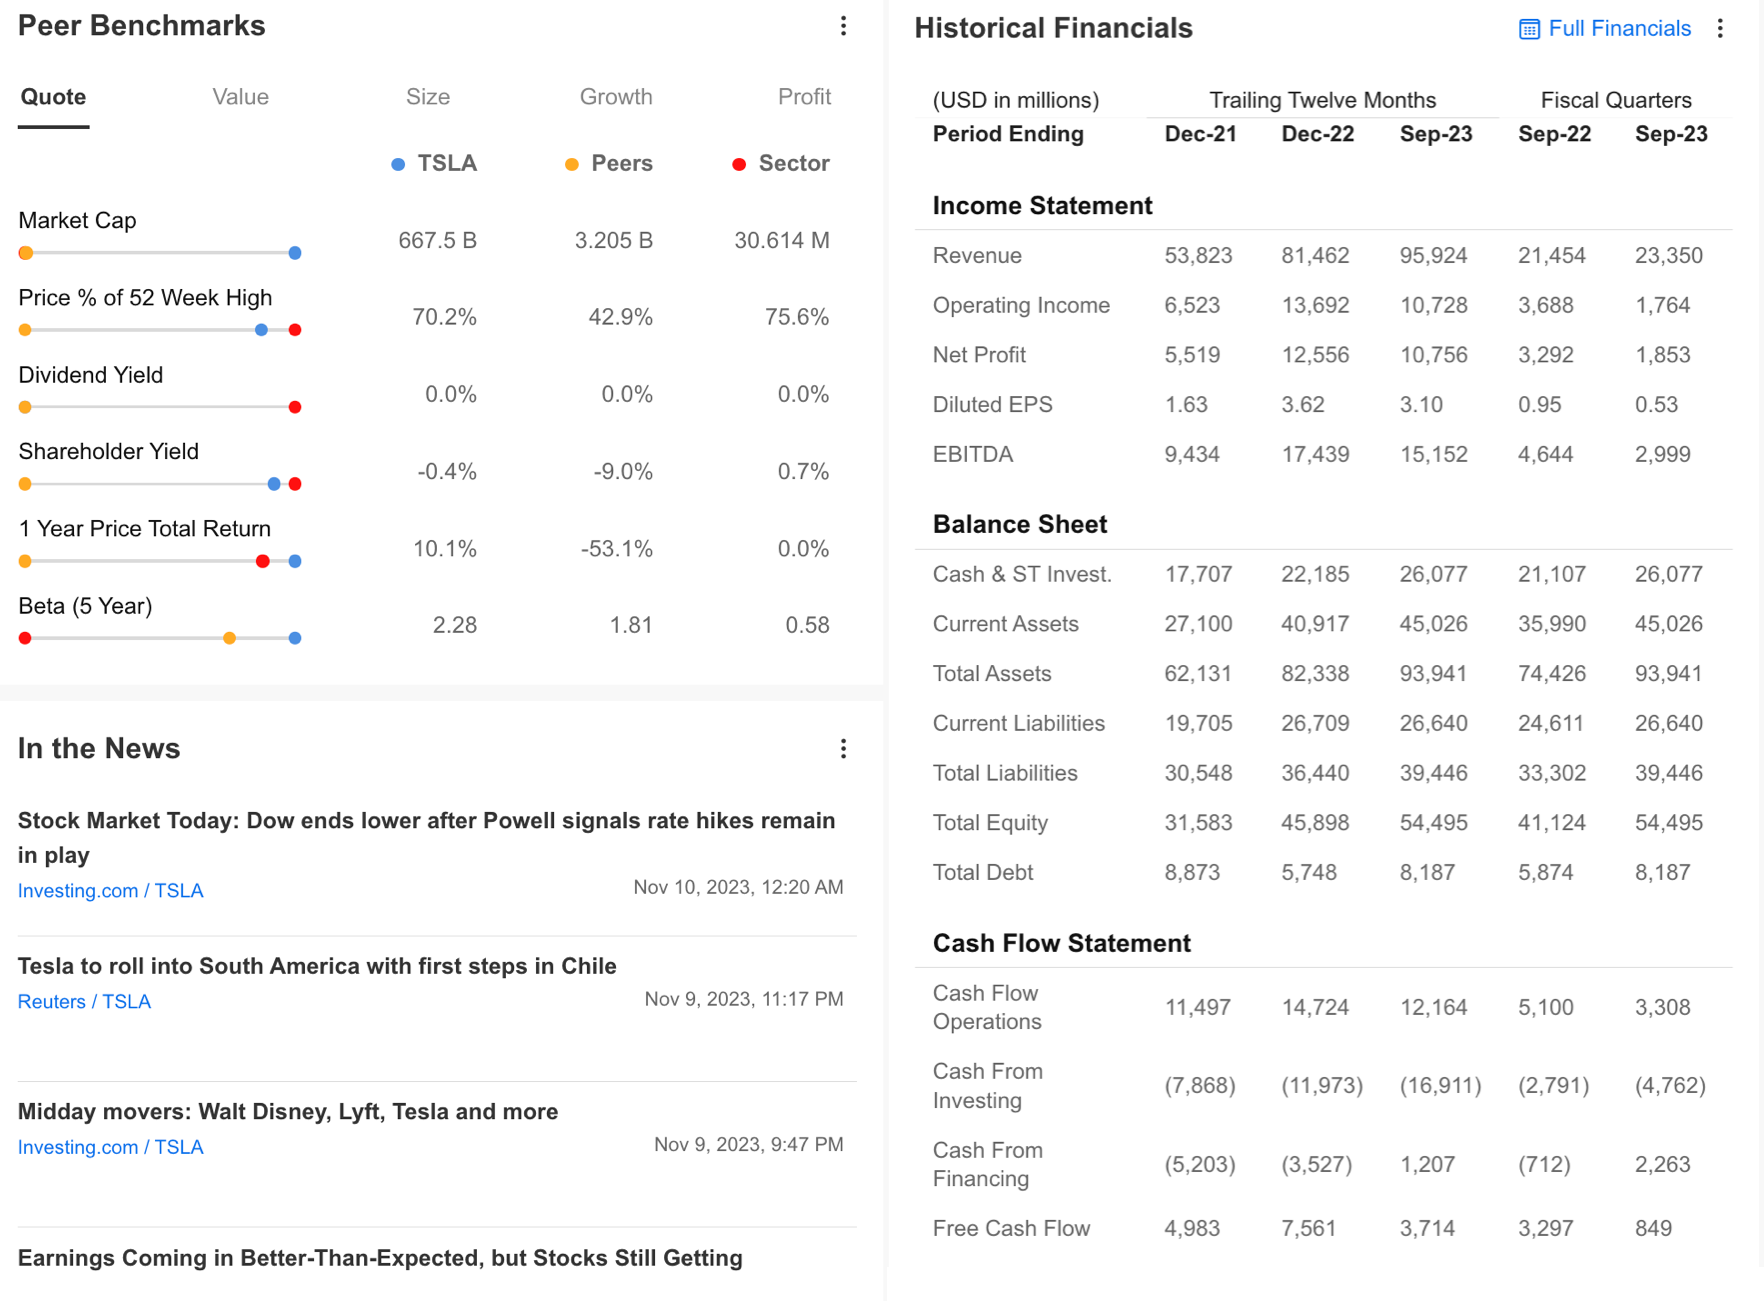
On the home page, you can also see a summary of the past financial results of the company you want to research, and you can switch to comprehensive financials from this area. There is also an area where you can compare the company with other peer companies and the industry, which you can also select yourself.
The Comparison Tab: Measure Your Company's Fundamentals Against Sector and Peer Benchmarks
Below is a screenshot of the comparison area, you can find a company-specific news tab, where you can quickly access the developments that cause possible volatile price movements, as well as an analysis of the company's stock.
Source: InvestingPro
Thus, you can find a lot of important information about the company you are researching even before you go deeper into InvestingPro. If you want to explore the summary information presented on the main screen in more detail, you can use the top tab.
If we evaluate the current information on Tesla stock up to this point; We can see that financial models and analysts expect an increase in the stock price. From the information presented in the summary, we can learn that the company continues to provide high returns and does not experience cash shortages in the current period when the cost of financing increases.
In addition, the information presented in the summary contains warnings that the company's share may experience some headwinds in the short term. The weak performance the last month, the downward revision of earnings expectations for the next period by 24 analysts, and the high price/earnings ratio are among the negatives impacting the stock.
On the other hand, the fact that TSLA stock is volatile indicates that it could be a riskier investment than its peers. This information can also be confirmed by the high beta value compared to the peer and industry average, as you can see in the company comparisons tab.
This useful and straightforward company-specific information, as seen in the Tesla example, will help you make the most of your savings.
Digging deeper into InvestingPro, we can access the most up-to-date and detailed information about the company and its share value as a professional investor. These include dividend yield, earnings, other financial items, detailed comparisons against peer companies and sectors, and strengths and weaknesses that indicate the health of the company.
Source: InvestingPro
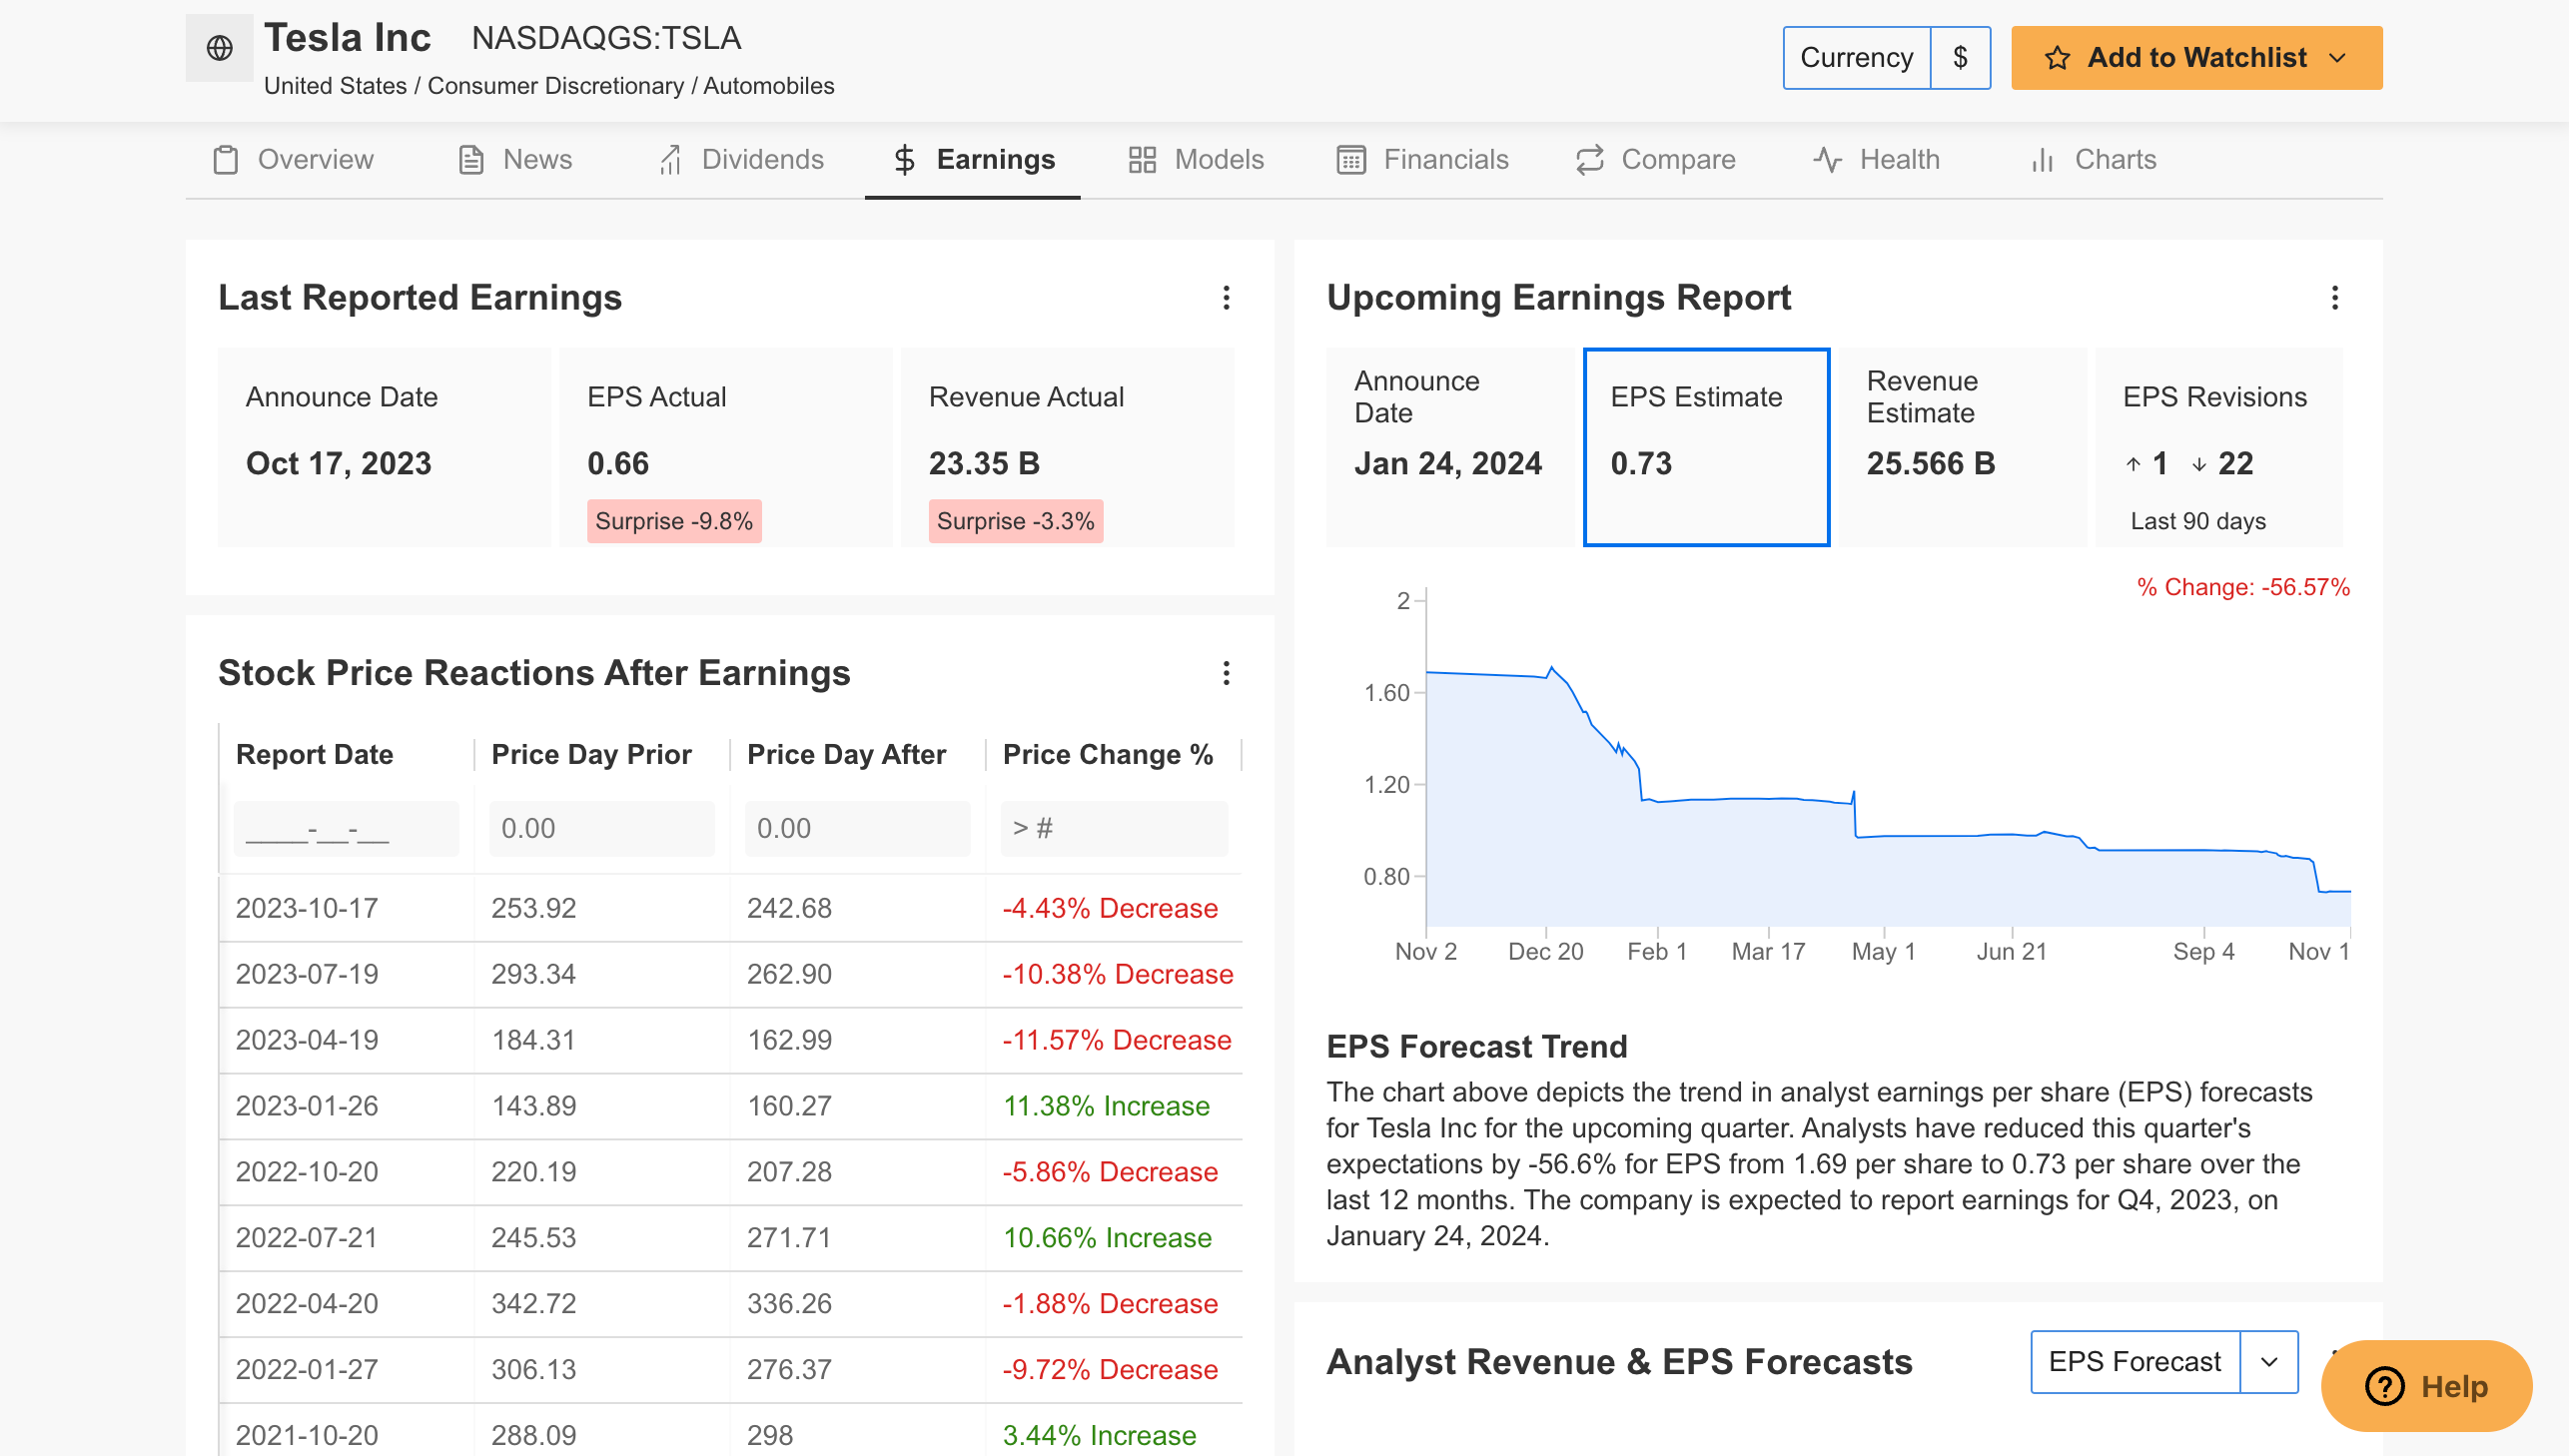
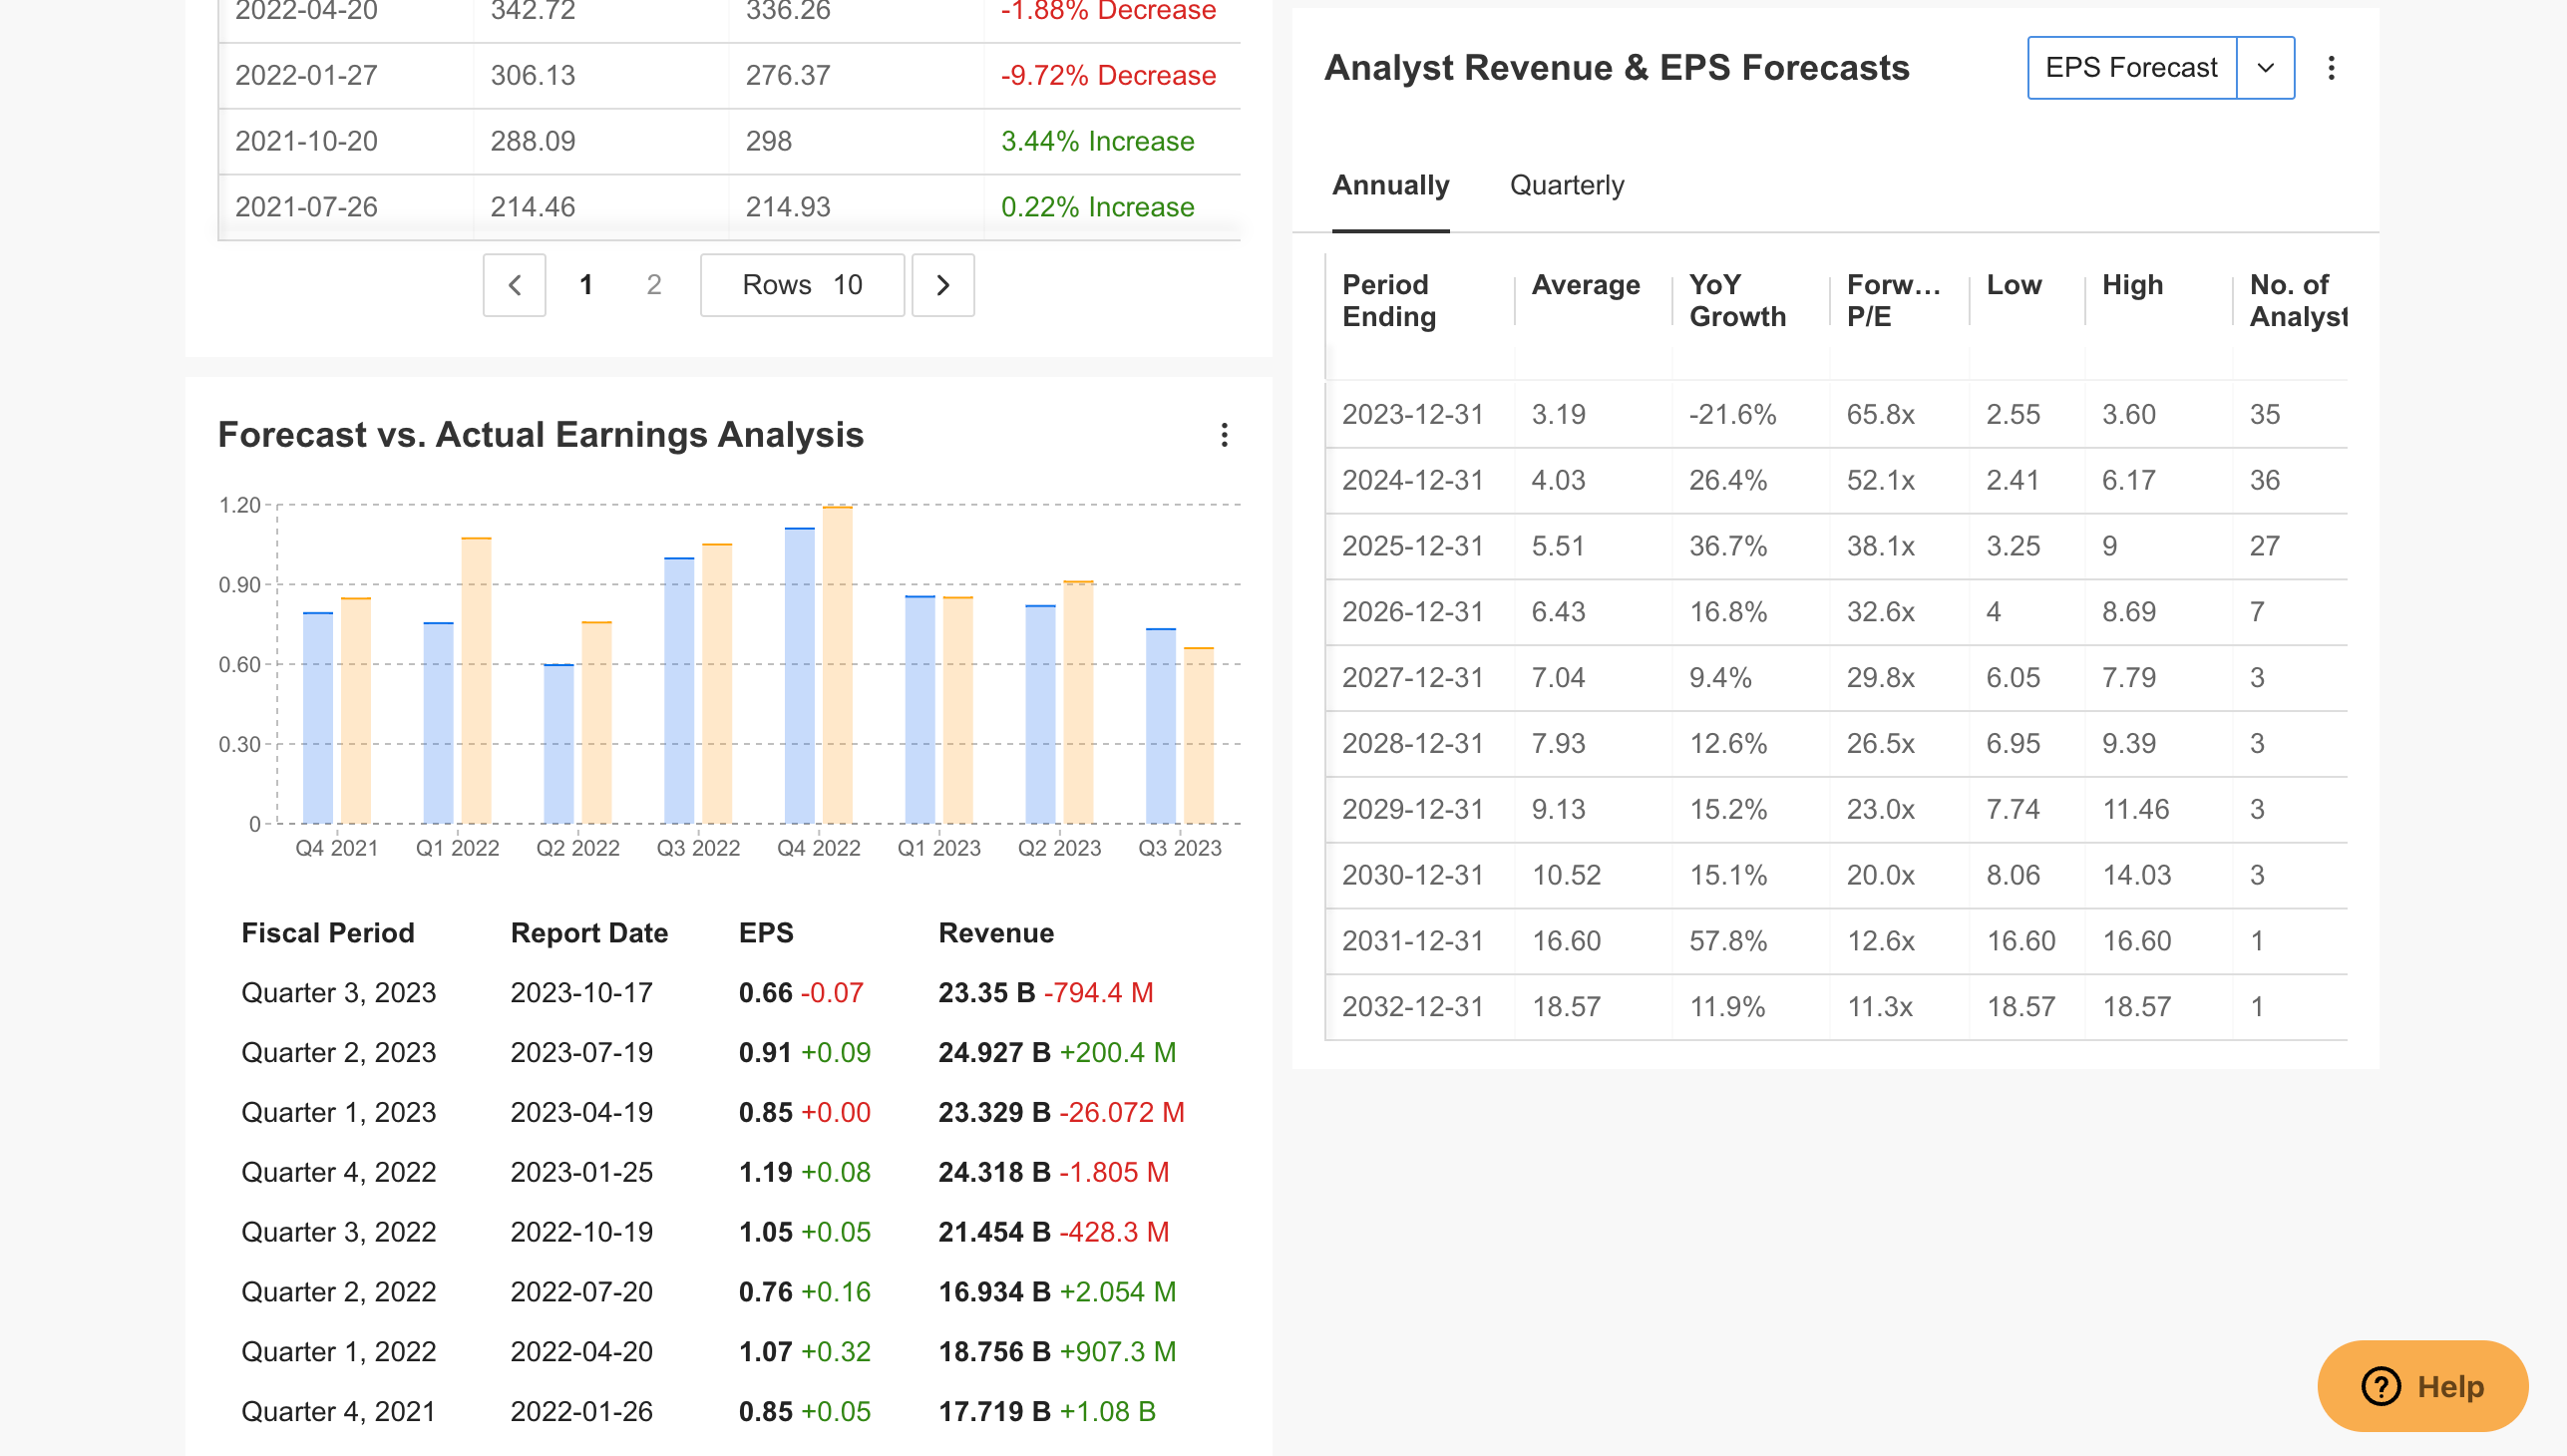
For example, the earnings tab provides critical information on how Tesla will perform in the short and long term. As we can see in this area, we can easily see that the company's earnings and revenue per share fell below expectations in the last quarter.
At the same time, for the next earnings period, analysts are forecasting a decline in the company's EPS and revenue. This information is presented in a very up-to-date manner and may change until the next earnings report depending on a possible development.
Source: InvestingPro
In the earnings section, you can also see how the company's stock has moved following the reports announced in previous periods. Thus, you can get an idea of how investors react to the earnings report and take a position in line with expectations. On the other hand, on InvestingPro, you can shape your portfolio by examining short and long-term forecasts for the company's revenue and EPS.
In the Financials section, the company's income statement can be examined in detail, while the current period and the past 10 years' data of important items can be seen on a single screen in the table supported by graphs.
In the comparisons section, the company's price performance can be evaluated according to the index and its peers. Here you can also specify the criteria you want to be compared. As we can see in the TSLA example, while the share price continues to outperform the S&P 500 index and its peers in the short and long term, it tends to slide below the S&P 500 with its underperformance in the short term. 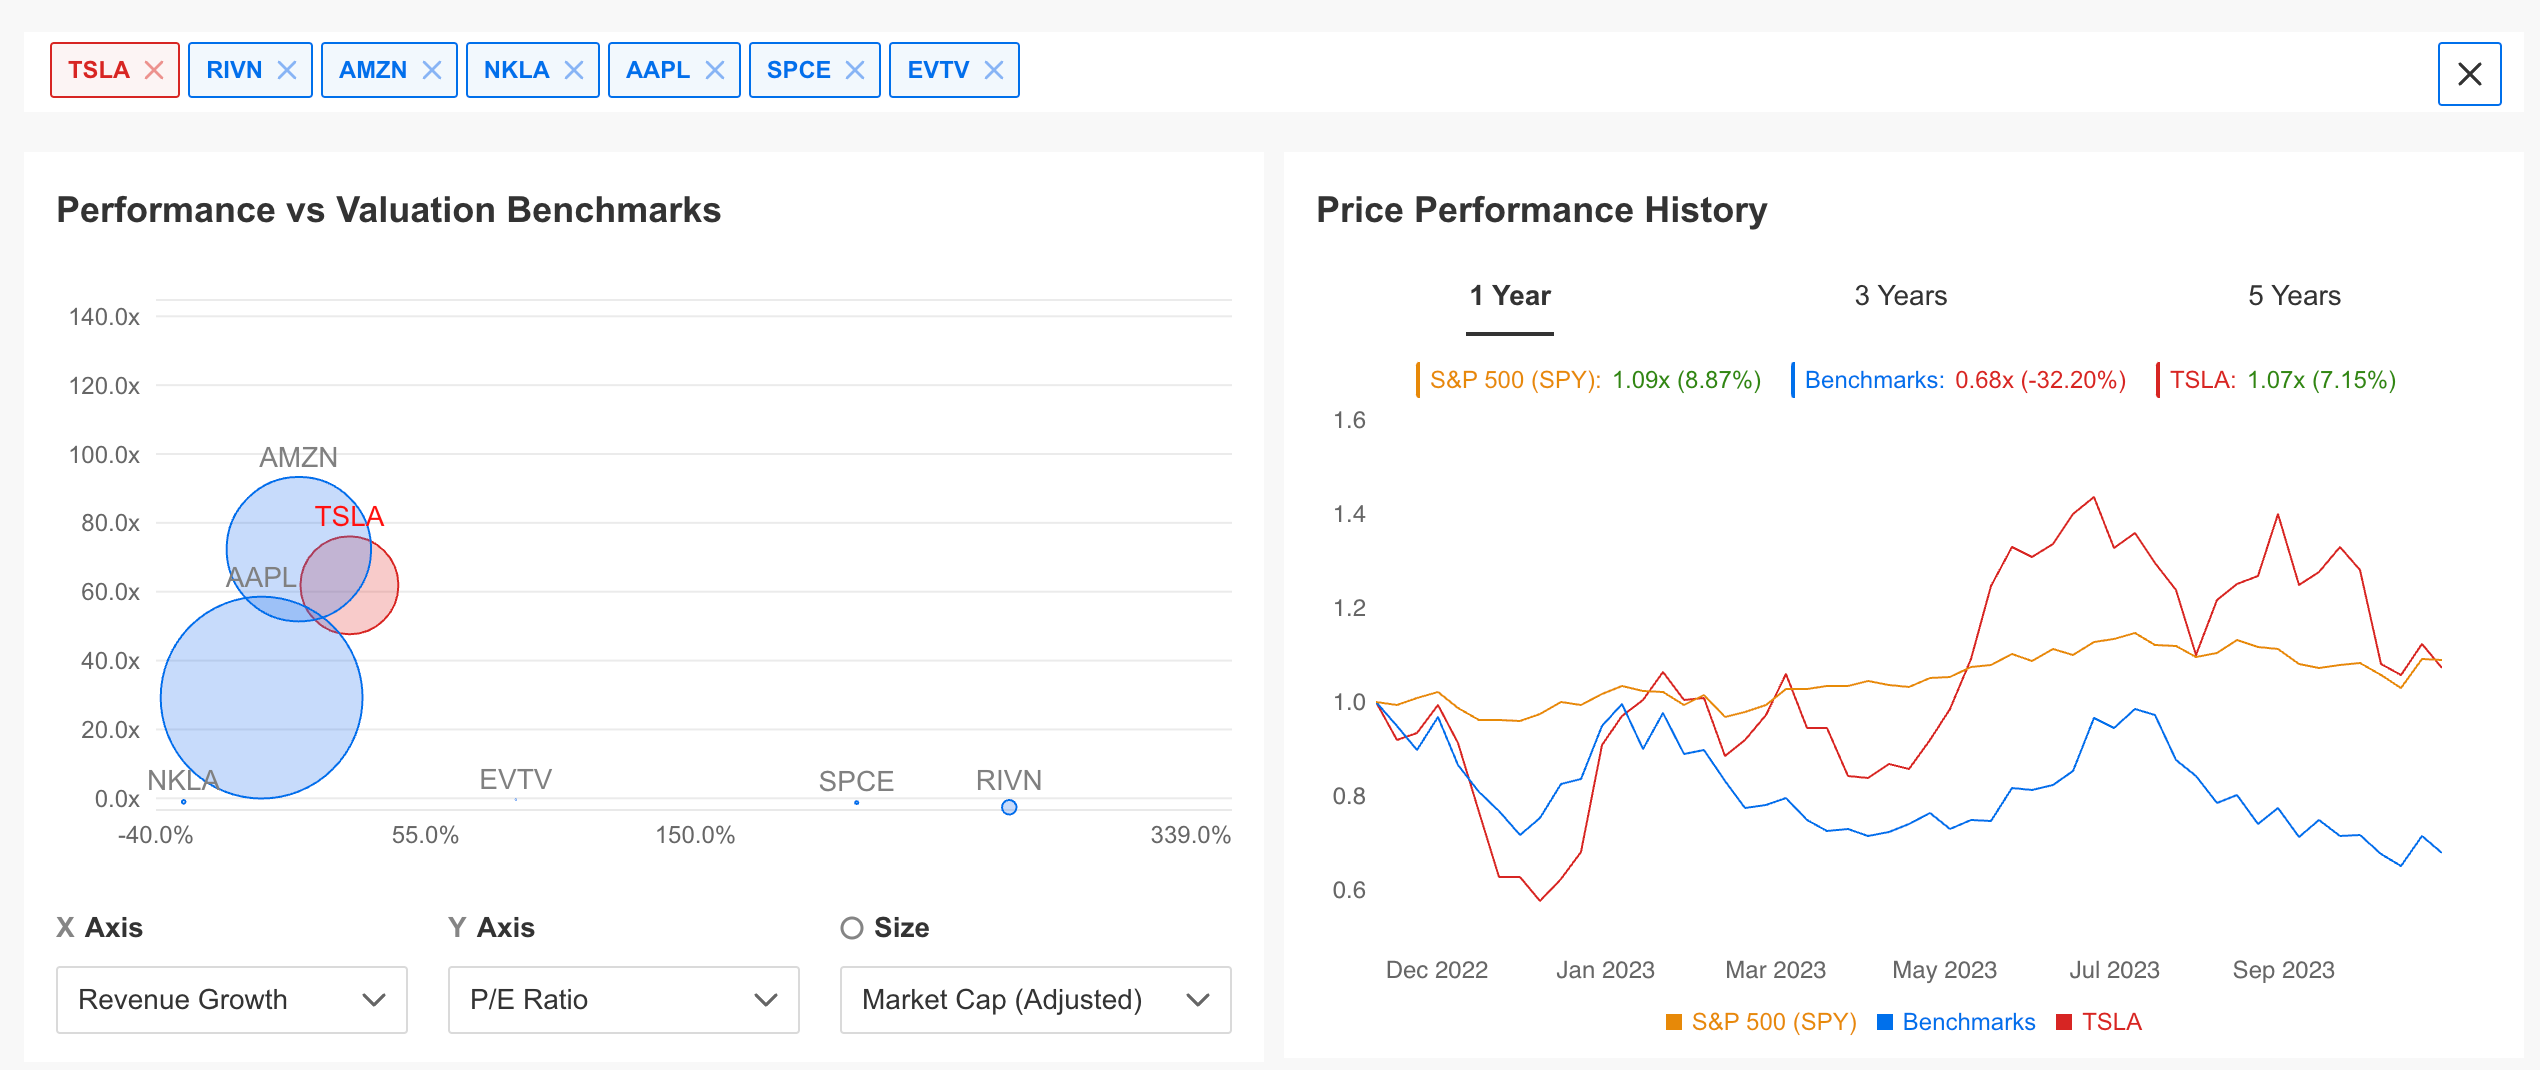
Source: InvestingPro
The summary table in the Comparison tab provides a very detailed comparison of the company you are researching against its peers. In this table, you can compare companies based on many criteria, from fair value analysis to dozens of ratios and InvestingPro forecasts.
Charts Tab: Visualize the Data Using This Section
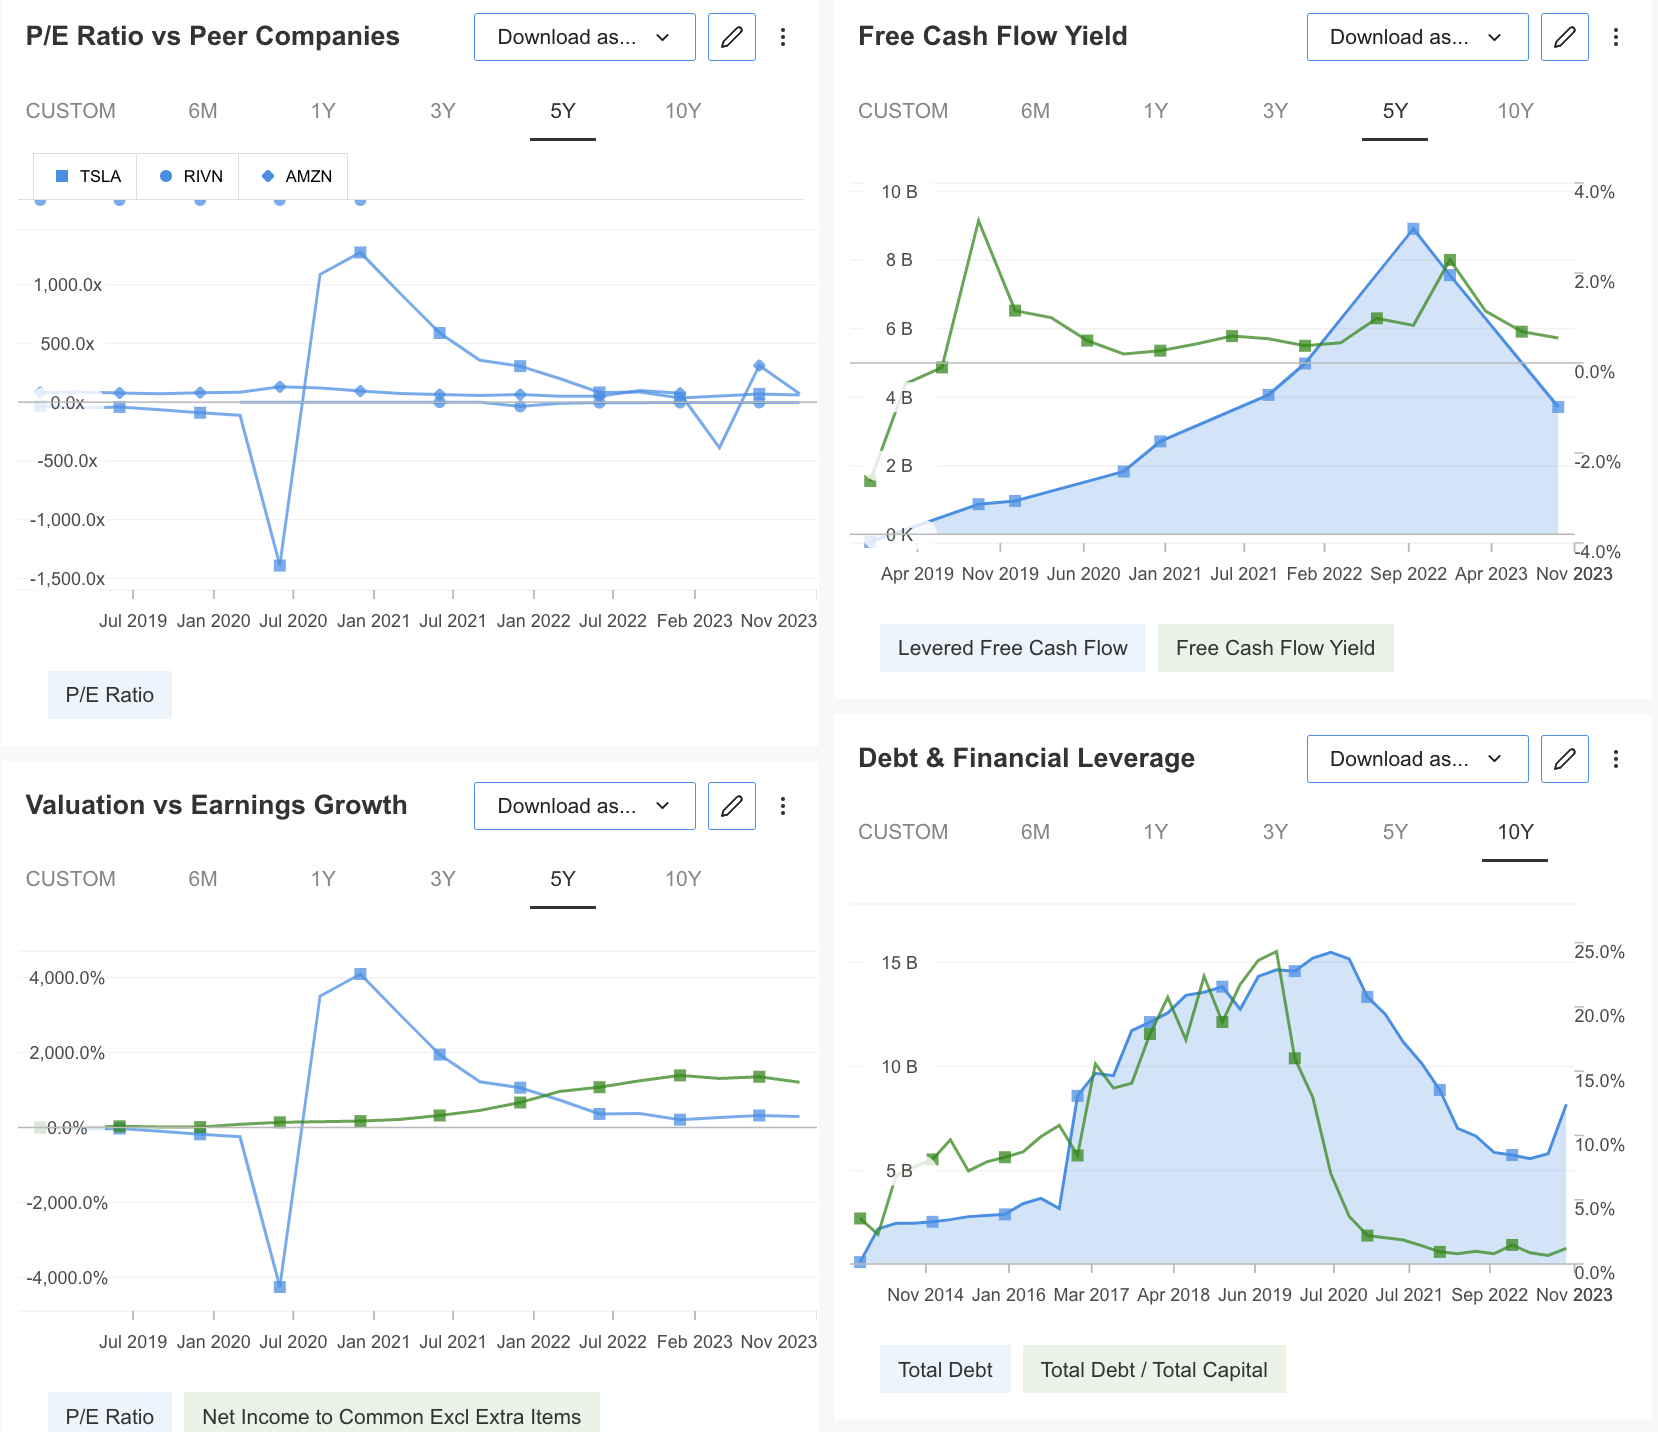
One of the most beautiful features of InvestingPro is that you can see all the data you evaluate with graphs. Thus, you can analyze visually supported data much more easily. In addition, you can save and export all these studies and easily use them in your content production and presentation works.
Source: InvestingPro
In addition to detailed stock analysis on the InvestingPro platform, you can professionally track your earnings by saving your portfolio. Thus, you can easily analyze the stocks in your portfolio based on the rich database.
What's More - You Can Follow Legendary Investors' Moves in the Market
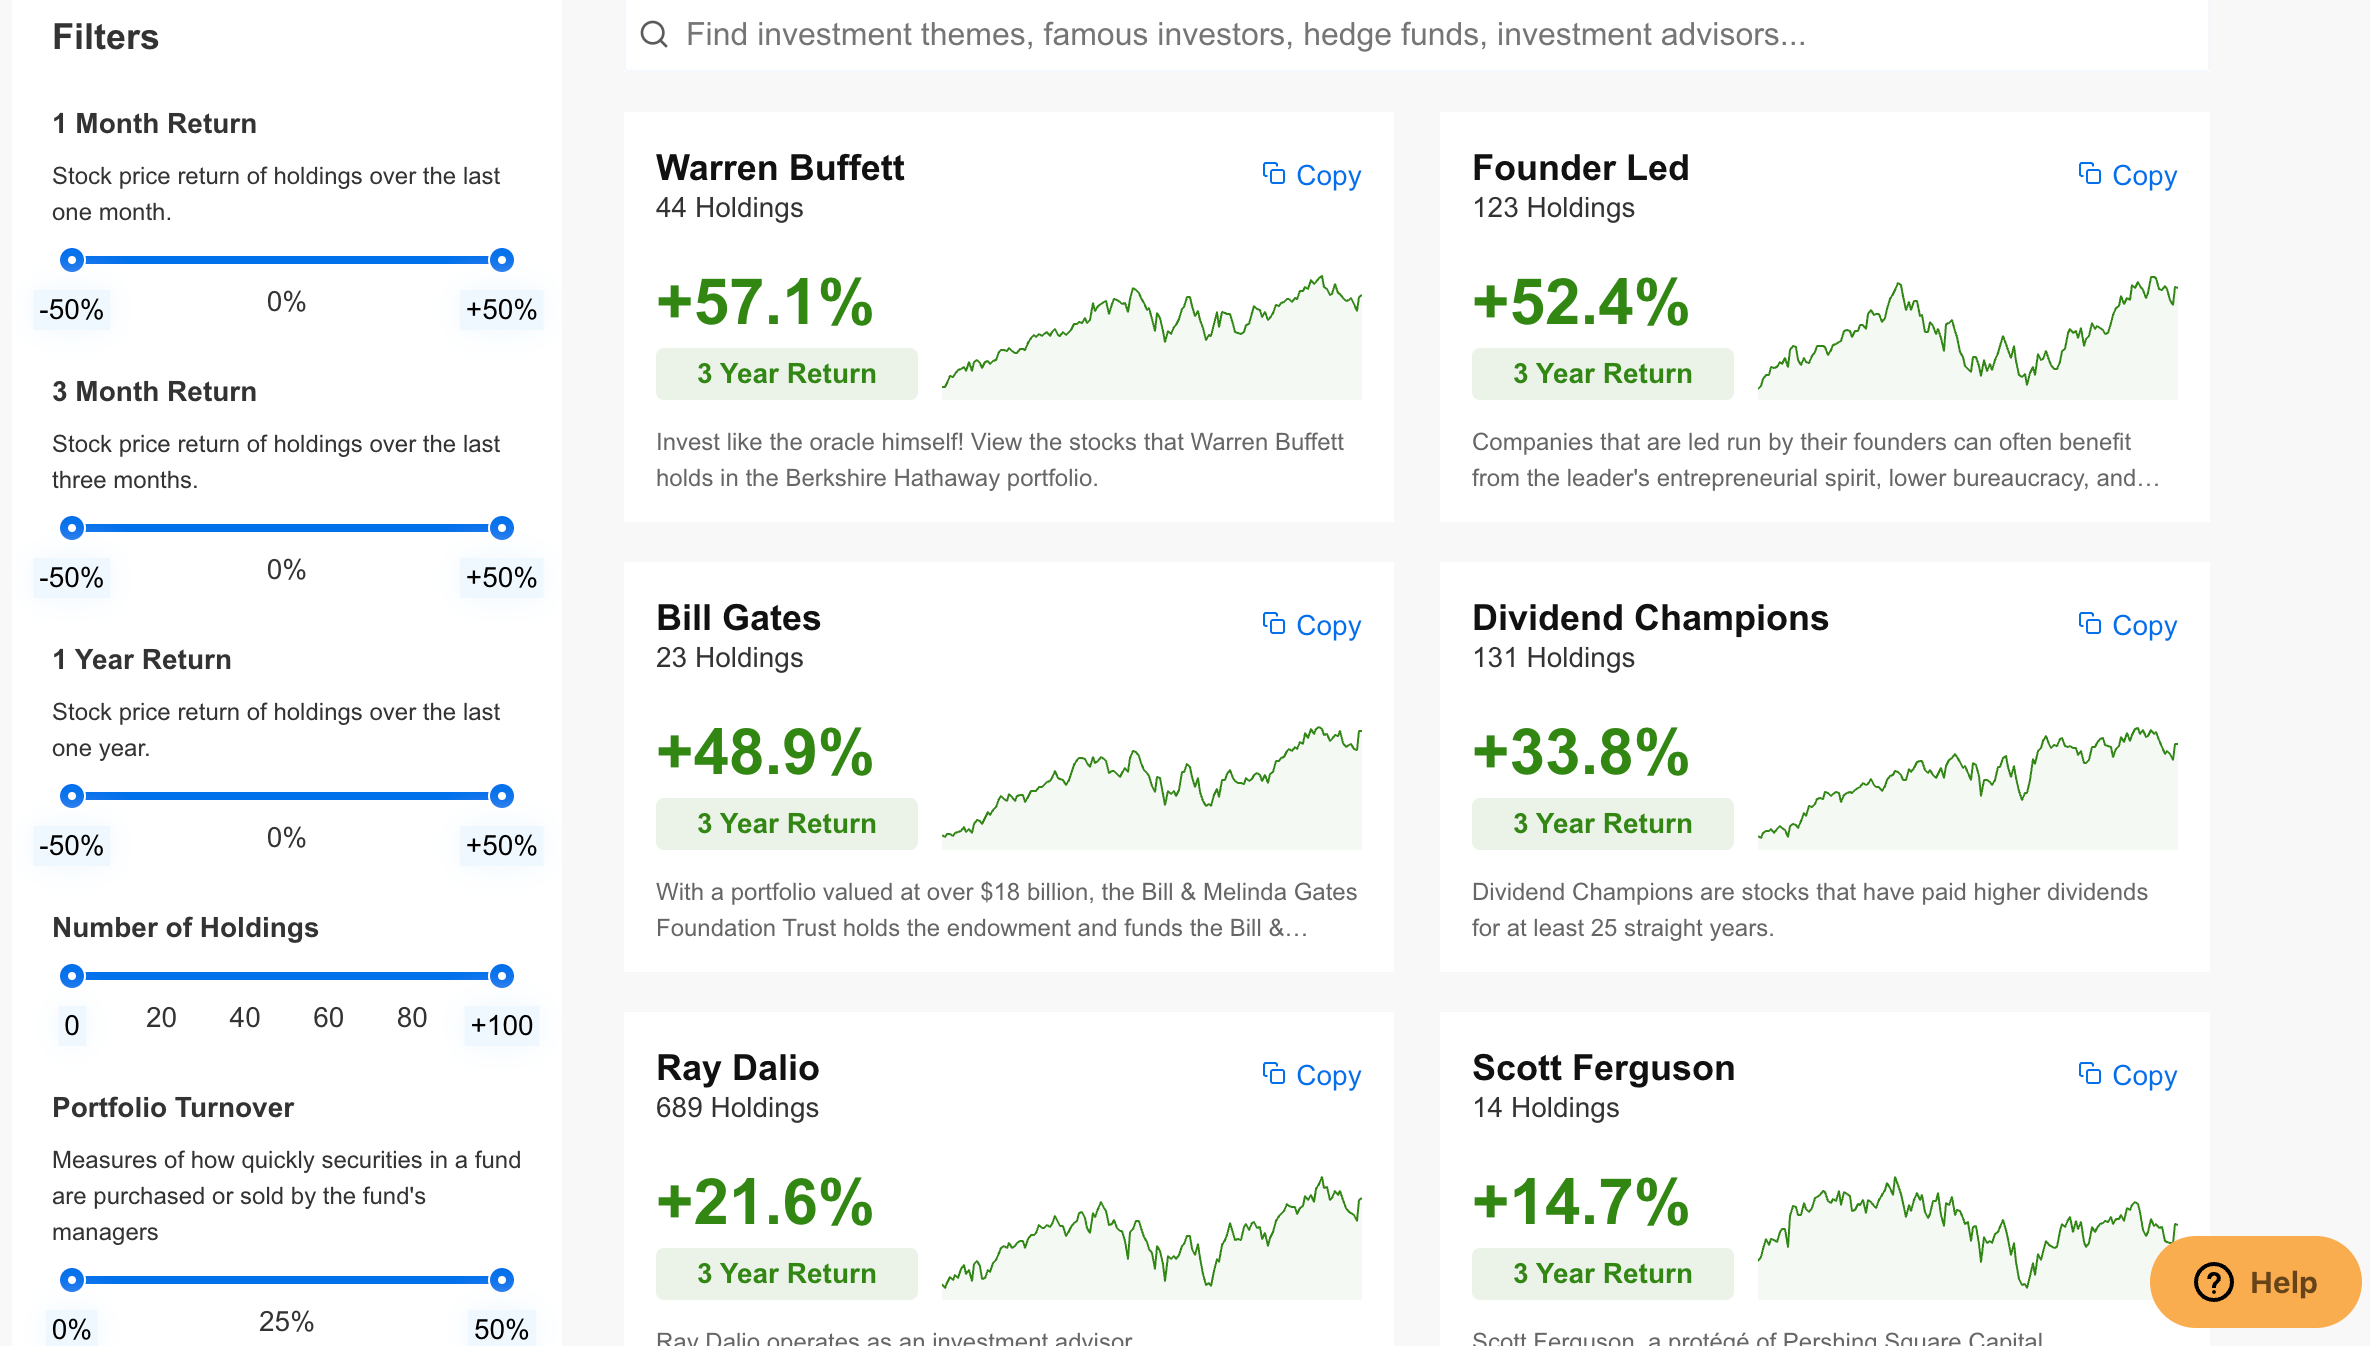
Another prominent feature of the platform is that you can see the portfolios of world-renowned investors and investment companies.
Source: InvestingPro
This allows you to build a stronger portfolio in the long run. You can also create a portfolio of high-potential stocks by selecting stocks from both domestic and foreign markets by filtering the prominent criteria on a sectoral basis.
Source: InvestingPro
In summary, InvestingPro is a powerful fundamental analysis platform that offers all the information about the stock markets from a single screen with its rich and up-to-date database to make the most efficient use of your savings.
***
Buy or Sell? Get the answer with InvestingPro for Half of the Price This Black Friday!
Timely insights and informed decisions are the keys to maximizing profit potential. This Black Friday, make the smartest investment decision in the market and save up to 55% on InvestingPro subscription plans.
Whether you're a seasoned trader or just starting your investment journey, this offer is designed to equip you with the wisdom needed for more intelligent and profitable trading.
Disclaimer: The author does not own any of these assets. This content is purely for educational purposes and cannot be considered as investment advice.

