
This article was written exclusively for Investing.com
- Natural gas futures are highly volatile
- The natural gas market changed in 2021 for three reasons
- Volatility a magnet for traders
- Degenerative Finance and the UGAS token
- Ethereum backs the UGAS token
Natural gas futures began trading on the Chicago Mercantile Exchange’s NYMEX division in 1990. Over the past thirty-one years, the natgas futures market developed into a benchmark pricing mechanism for the energy commodity.
While the exchange futures reflect prices at the Henry Hub, the delivery point in Erath, Louisiana, natural gas for delivery in other locations tends to trade at prices that are at discounts or premiums to the benchmark. The local nature of the market can make the price differentials vary dramatically.
Aside from being a tool for producers and consumers, the high price variance in the natural gas futures arena has attracted many speculators looking to profit from volatility. Since their introduction, the futures have traded as low as $1.02 per MMBtu to as high as $15.65 per MMBtu. Natural gas is an energy commodity that tends to double, triple, or halve in price over relatively short periods, making it a speculator and trend-follower's dream.
As the cryptocurrency market has grown, new tokens with novel utilities have been introduced. The UGAS token operates on the Ethereum platform. Its protocol states, “for an industry rife with pure-play speculation, gas futures offer real utility for those building and working within the Ethereum network.”
Natural gas futures are highly volatile
Natural gas’s price can be as combustible as the energy commodity in its raw form. 
Source: CQG
The quarterly chart dating back to 1990 shows that quarterly historical volatility has ranged from just over 12% to over 80%. The daily price variance metric has routinely moved over the 100% level over the past three decades.

Source: CQG
The daily chart shows that volatility rose to over 116% in October and was north of 78% on Nov. 16.
Volatility can be a nightmare for investors, but it creates a paradise of opportunities for traders that embrace wild price swings.
The natural gas market changed in 2021 for three reasons
Natural gas reached its highs at over $10 per MMBtu in 2005 and 2008 as Hurricanes Rita and Katrina wreaked havoc along the Louisiana Coast. From 2008 through June 2020, the natural gas market declined steadily, making lower highs and lower lows, leading to a quarter of a century low at $1.432 per MMBtu during June 2020.
Discoveries of massive natural gas reserves at that time in the US Marcellus and Utica shale regions led to a glut of the energy commodity. Since necessity is the mother of invention, the demand side of natural gas’s fundamental equation responded to the quadrillions of cubic feet in US reserves.
Natural gas replaced coal in power generation, and liquification allowed natural gas to travel beyond the US pipeline system to areas of the world where prices are appreciably higher. Today, LNG moves worldwide via ocean vessels.
Three factors have caused natural gas futures price to experience an explosive rally that took the price over four and one-half times higher from the June 2020 low to the October 2021 $6.466 per MMBtu high.
- Addressing climate change has increased regulations on extracting US oil and gas from the earth’s crust. In May, the Biden administration banned drilling and fracking on federal lands in Alaska.
- Rising inflationary pressures because of the tidal wave of central bank liquidity and tsunami of government stimulus have caused all commodity prices to appreciate, and natural gas is no exception.
- Rising global energy demand in the wake of the pandemic has lifted energy prices. At over $80 per barrel, crude oil puts upward pressure on natural gas demand. At over $2.50 per gallon, ethanol does the same. Moreover, coal prices rose to the highest price in decades in October, supporting natural gas prices.
As well, November is the peak season for natural gas heating demand in the US and Europe, and inventories are lower than last year and below the five-year average.
Volatility a magnet for traders
Like bees to honey, volatility attracts trend-following traders and speculators. The natural gas futures arena has always been a magnet for market participants looking for action.
Over the past years, the emergence of the cryptocurrency asset class has given price variance a new meaning. It should come as no surprise that out of over 14,300 tokens now circulating in cyberspace, a natural gas-related token has emerged. Compounding the volatility of natural gas and cryptocurrencies could be a wild ride for those looking for turbocharged price action.
Degenerative Finance and the UGAS token
Degenerative Finance is a collaboration between Yam Finance and the UMA Project to develop a suite of innovative DeFi derivatives, starting with the launch of UGAS, which tracks and hedges the cost of gas on the Ethereum blockchain. The Degenerative Finance website states there are “many more exciting synthetics to come.”
Synthetic tokens like UGAS are collateral-backed and fluctuate, depending on the token’s reference index. Synthetic contracts begin with a collateral deposit into a smart contract, leading to minting tokens backed by that collateral.
Ethereum backs the UGAS token
The UGAS token website notes the cryptocurrency was built by uLabs using Ethereum-based smart contracts and “can be used for hedging or speculating on Ethereum gas prices. This is an experimental token; please use at your own risk.”
As of Nov. 16, 2021, the UGAS token was ranked the 1789th leading cryptocurrency and was trading at $0.009337 per token. On Nov. 18 it had moved to 1784th place, trading at $0.008007 at time of publication.
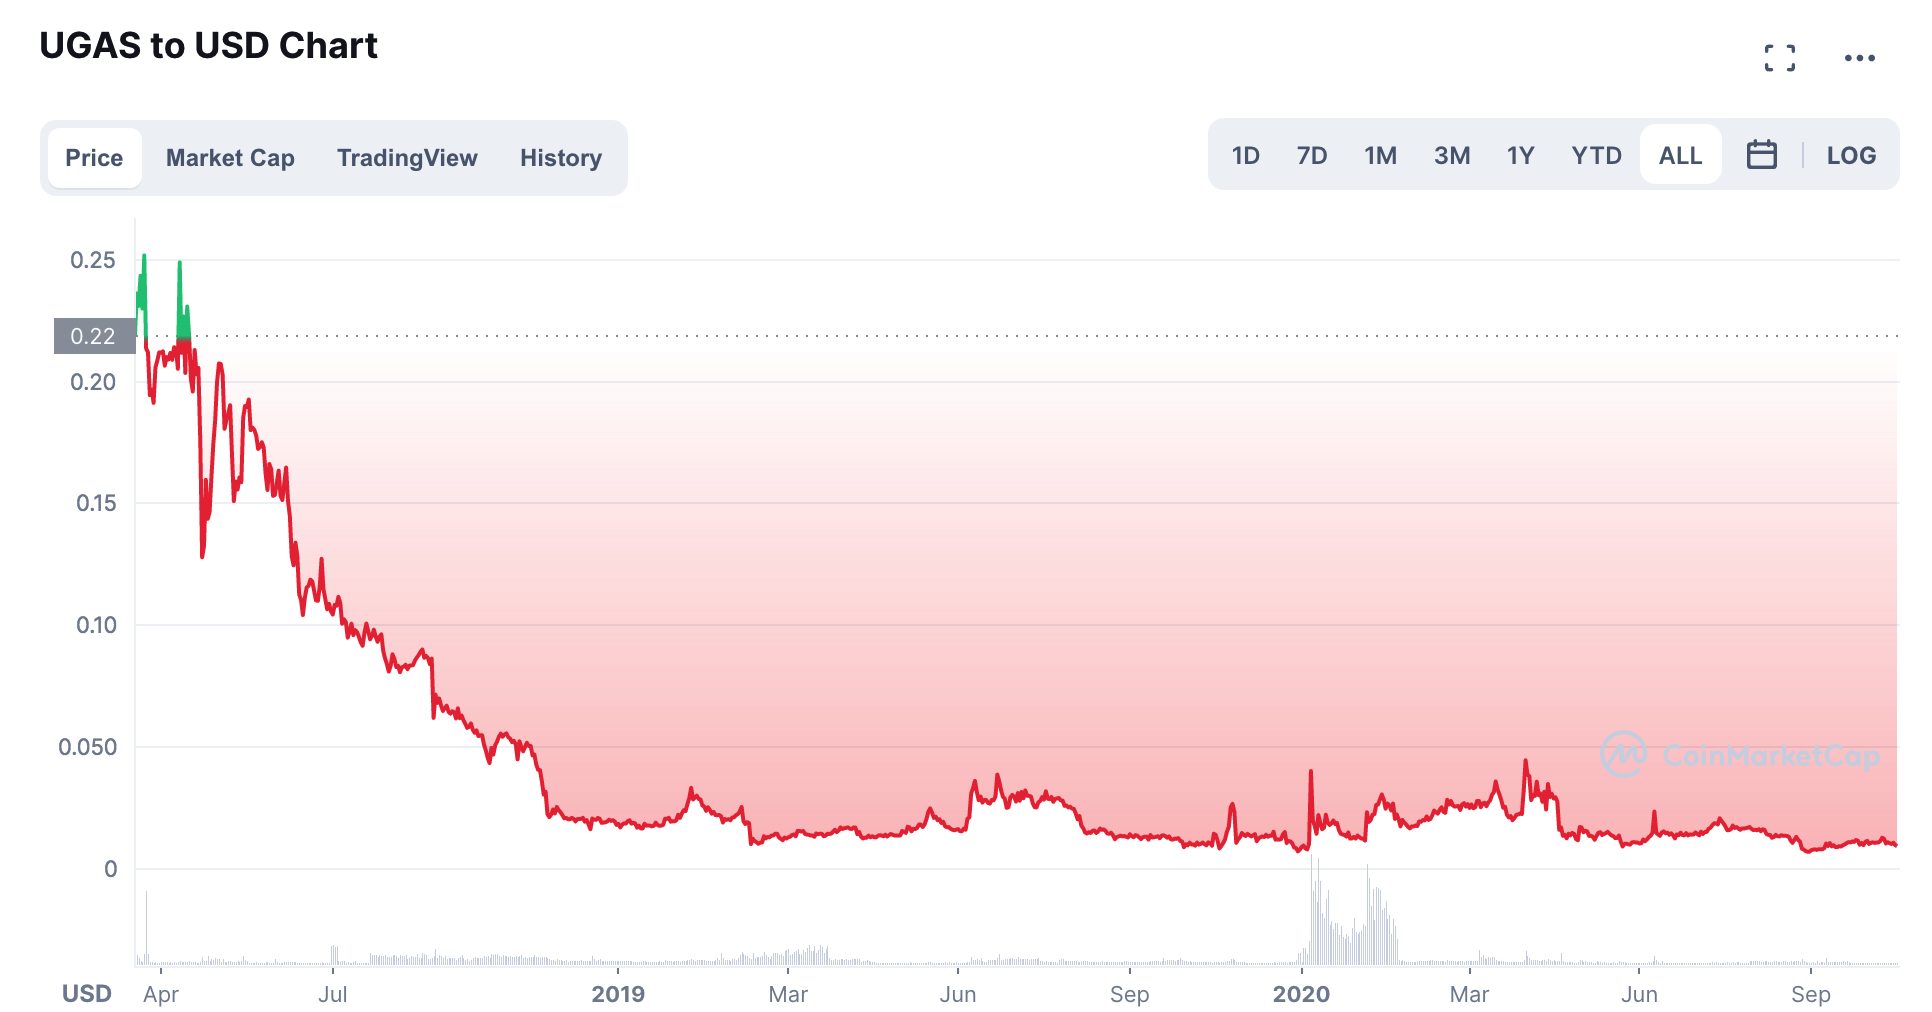
Source: CoinMarketCap
The chart shows the UGAS token began trading on Apr. 17, 2019, at 23.61 cents per token. At that time, nearby NYMEX natural gas futures were trading below $2.66 per MMBtu. On Nov. 16, 2021, at well over $5 per MMBtu, the commodity’s price was nearly double, while the token was at $0.009337, a fraction of its price in Apr. 2019.
Anyone using the UGAS token should do their homework in order to understand how the cryptocurrency operates and can be useful. Comparing the token to current natural gas prices leads one to believe that the digital currency has no relation to the commodity.
Plus, as with any crypto, make sure to do your homework and keep an eye on the price action. There are no guarantees. The best indicator that a token will perform is a track record, something sorely lacking in the case of the UGAS token.
Which stock should you buy in your very next trade?
With valuations skyrocketing in 2024, many investors are uneasy putting more money into stocks. Unsure where to invest next? Get access to our proven portfolios and discover high-potential opportunities.
In 2024 alone, ProPicks AI identified 2 stocks that surged over 150%, 4 additional stocks that leaped over 30%, and 3 more that climbed over 25%. That's an impressive track record.
With portfolios tailored for Dow stocks, S&P stocks, Tech stocks, and Mid Cap stocks, you can explore various wealth-building strategies.