
In our previous update for the S&P 500, see here, we found, using the Elliott Wave Principle (EWP),
“… the decline since the July 27 high, at $4707, [to the August 18, $4335 low] counts best as three waves down, which means that the most bullish possibility cannot yet be eliminated: the decline was a correction.”
That possibility requires,
“[a rally] through $4525, towards the $4550-4600 region and hold above $4458 on any pullback. Then chances increase the recent month-long decline was indeed only a correction, and we should look for $4790+/-10 to be reached before the Bears have another chance.”
As such, we also presented an alternative scenario/possibility:
“… a rally to ideally $4500+/-25. From there, the index must break first below the $4458 high, followed by the August 18 low to usher in red W-iii/c to ~$4075.”
Fast forward, and the index rallied through $4525 to as high as $4541 on September 1st but failed to reach the $4550-4600 region as it dropped below $4458 on September 6. Thus, the rally from the August 18 low to the September 1 high was most likely in three waves, not five. See the price action in the orange box in Figure 1 below.
Figure 1. Daily SPX chart with detailed EWP count and technical indicators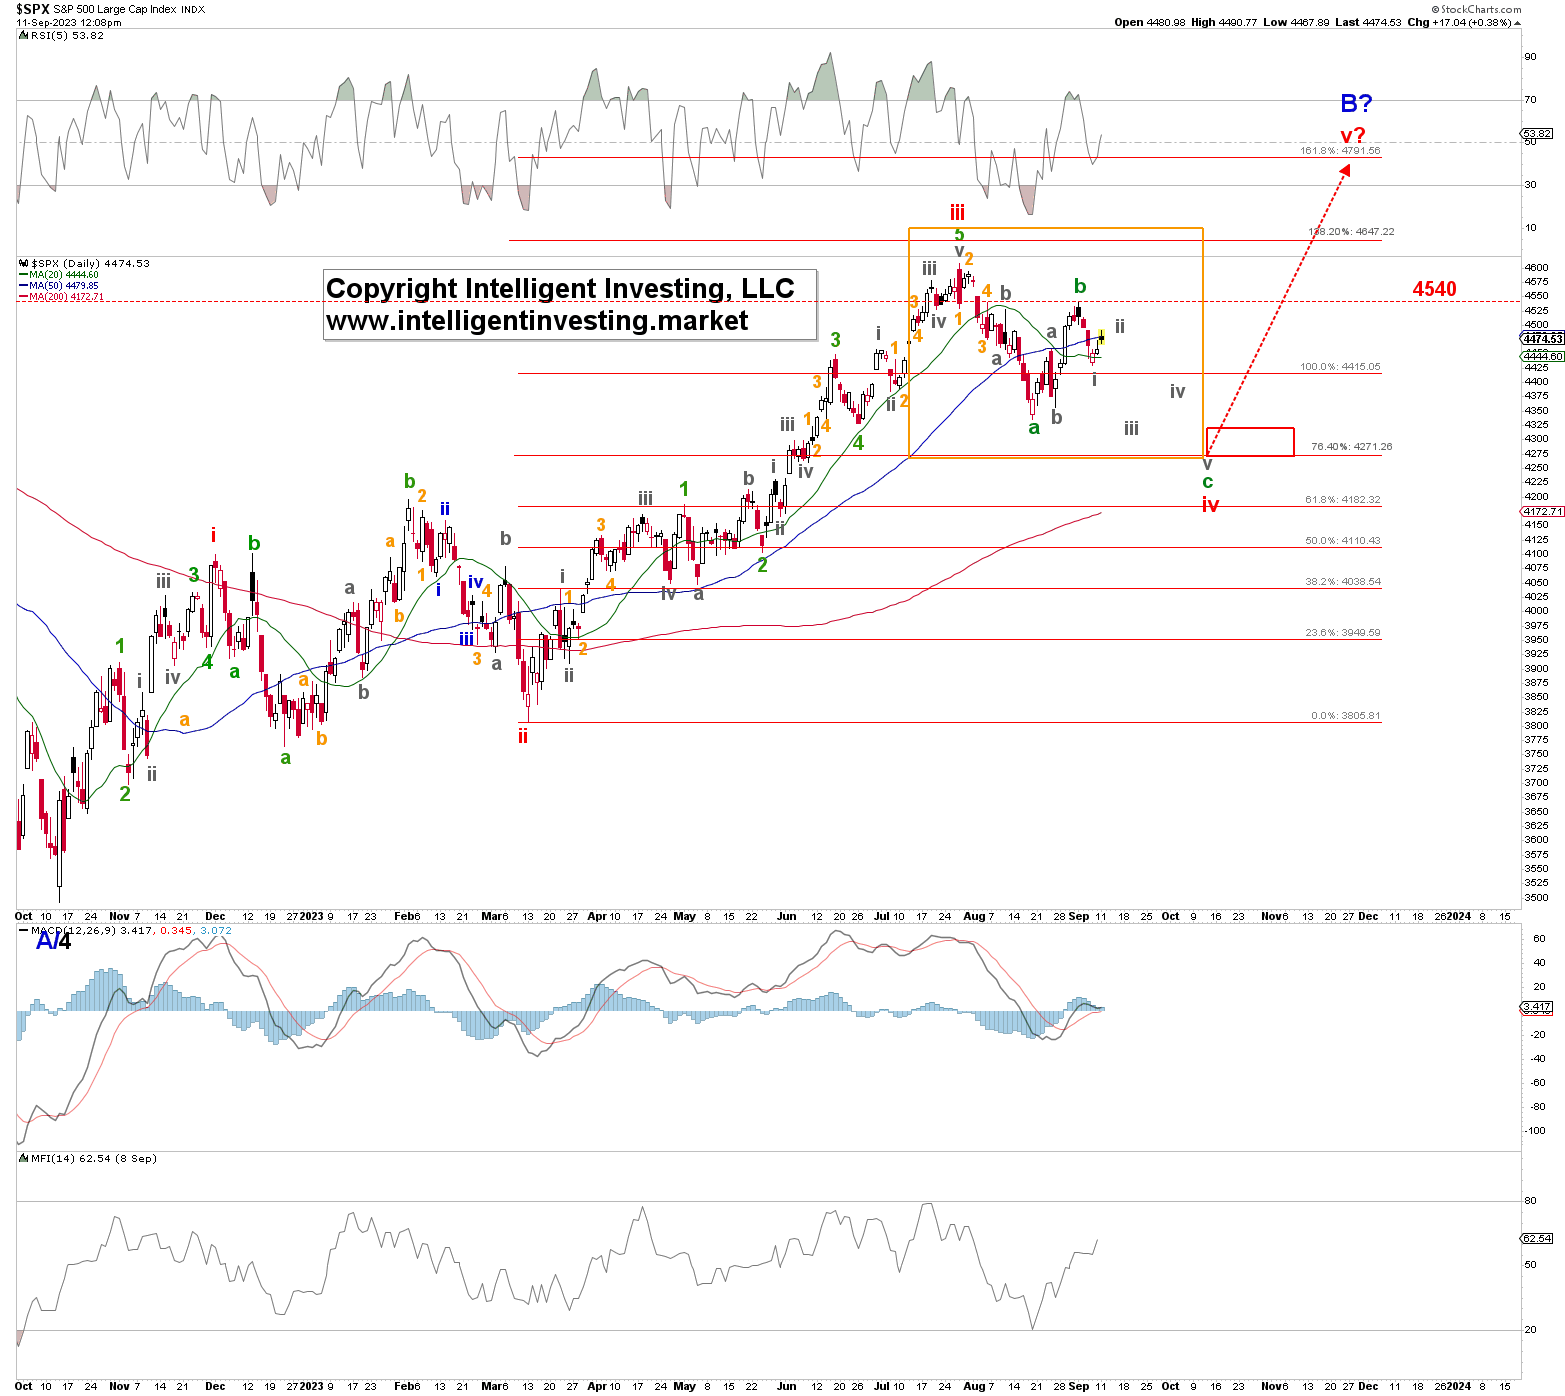
As such, we are now presented with a “three waves down, followed by three waves back up” scenario.” In other terms, the correction that started from the July 27 high is morphing from a simple pattern to a complex one. Most likely a 3-3-5 flat correction. Or as we always say, “after three waves down, expect at least three waves back up”.
Five waves lower targets $4270
Thus, our preferred scenario, as for the Nasdaq 100 (see here), is for the SPX to rally to around $4490+/-10, which it achieved today, and then drop to ultimately and ideally ~$4270+/-10 in five (grey) waves. See Figure 2 below. In more detail, we expect orange W-c to be underway and stall out in the target zone for grey W-ii. A drop below the grey W-i low ($4430 on September 7), will then trigger the grey W-iii, iv, and v sequence to ideally $4330+/-15, $4400+/-10, and $4270+/-10; respectively. The latter target zone is also where green W-c equals the length of green W-a, measured from the green W-b (September 1) high. A typical c=a relationship. Moreover, it is also where the (red) 76.40% extension of red W-i resides (see Figure 1 above)
Figure 2. Hourly SPX chart with detailed EWP count and technical indicators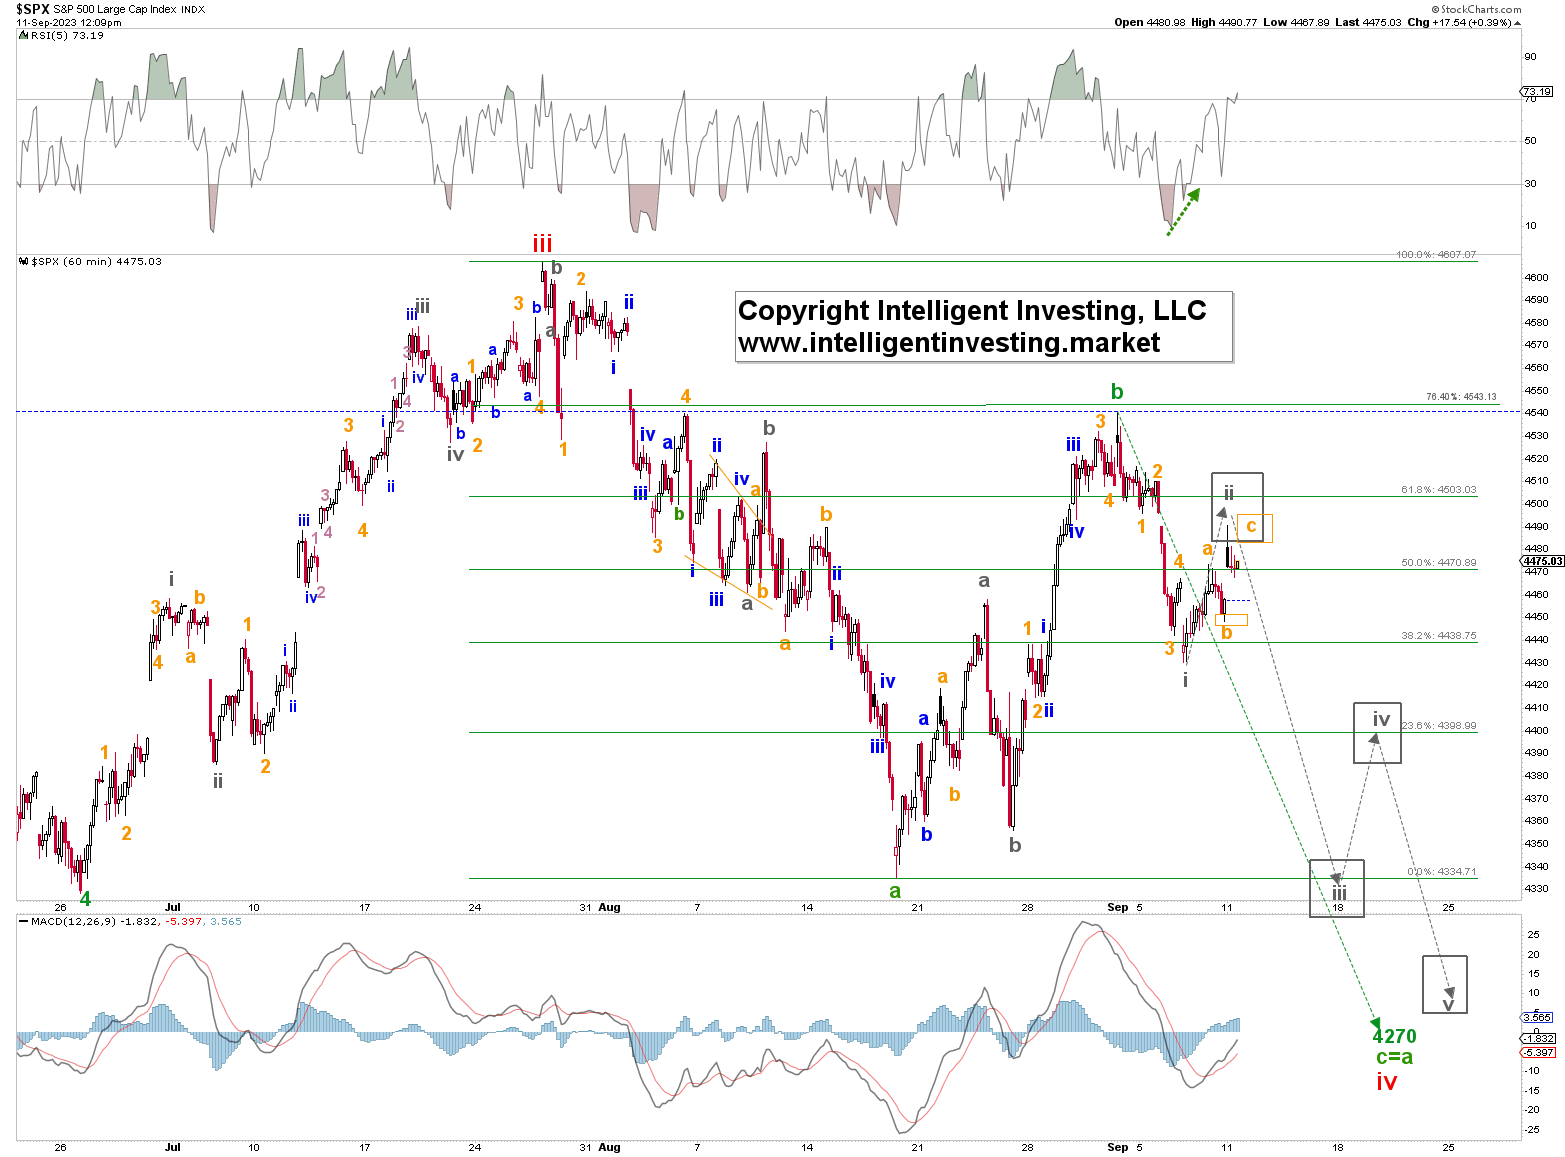
Thus, the index must stay below $4541, stall at around $4490+/-10, and then drop below $4430 to trigger a decline to ideally $4270+/-10. At that level, the index should then have completed a classic a-b-c correction, where W-c = W-a, and then the index is set up for $4790+/-10 once again before the Bears have another chance. Above $4541 means our primary assessment is wrong and we will need to re-analyze.
Lastly, please remember that financial markets are complex systems, i.e., composed of many parts (millions of participants) that interact according to nonlinear rules (e.g., emotions). As such, it is impossible to predict such a system’s future even by knowing what is happening now to all its parts. But, despite this analytical unpredictability, we can observe repeating, stable patterns, such as the Elliott Waves, in how the system behaves over time, allowing us to approximate and prognosticate.