It has been some years since the last review of the Shareswatch Australia Random Stocks Portfolio and so it will be interesting to see what impact the slump in commodities prices has had upon it. The last review of the portfolio was back in November 2013 when the S&P/ASX 200 was around 5400.
At the last review in late 2013, commodities prices were still helping to edge the Australian stock market higher. But in just a few months the situation would change and the downward trend for most commodity related stocks would begin.
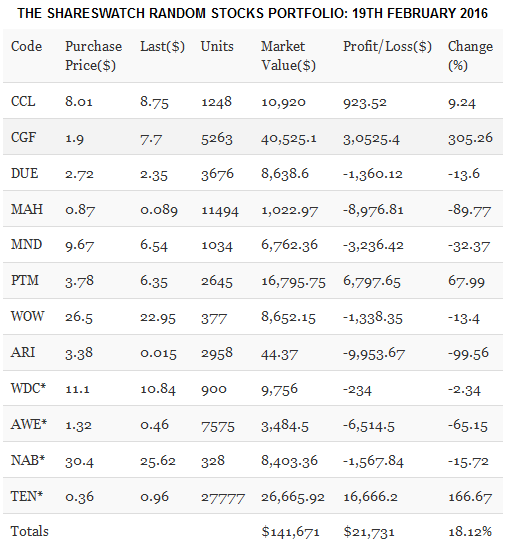
Despite this, the overall portfolio is still holding onto a gain of just over 18%. However, back at the last review in November 2013 the unrealised gain was around 38% so clearly the last few years have not been kind to the portfolio. The major drag on performance has been the commodities-related stocks and also somewhat surprisingly a few blue chip companies – namely Woolworths Ltd (AX:WOW), National Australia Bank (AX:NAB) and Westfield Group (AX:WDC).
As can be seen in the table below, there are now unrealised losses with most of the holdings, but thankfully a few star performers are keeping the overall portfolio in the black. The star performers being Challenger Limited (AX:CGF) and Platinum Asset Management Limited (AX:PTM)

* Indicates added to the portfolio in March 2013
If we look at a some charts we can see just how nasty the last few years have been to companies with exposure to commodities or the mining and energy sectors.
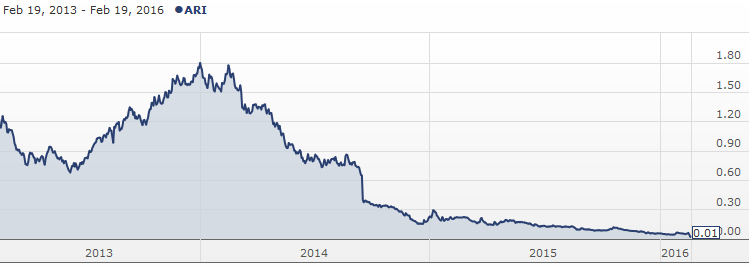
Arrium Ltd (ASX:ARI) – 3 year stock price chart
Since the start of 2014 it’s been generally all downhill for ARI and then things only got worse. As of the 19th February 2016 the portfolio’s theoretical investment of around $10,000 AUD into Arrium Ltd (AX:ARI) back in October 2008 was worth just $44.37. That’s a pretty good example of how brutal the stock market can be and why it’s best to hold a range of stocks and not been too focussed on any one company – no matter how good it appears.
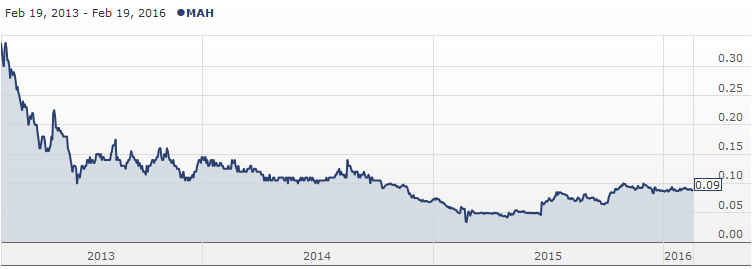
Macmahon Holdings Limited (ASX:MAH) – 3 year stock price chart
Macmahon Holdings Ltd (AX:MAH) provides engineering services to the mining sector and its share price has also fallen significantly over the last few years. In terms of the portfolio, the theoretical value of shares in this company has fallen by around 90% since 2008.
Finally to finish with a stock that is helping support the portfolio.
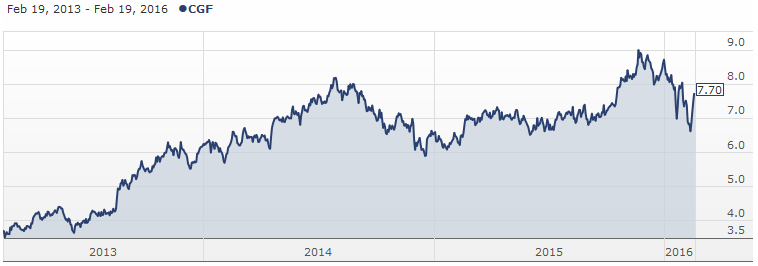
Challenger Limited (ASX:CGF) – 3 year stock price chart
Despite the recent market pull-back, Challenger Ltd (AX:CGF) shares are up around 305% since they were included in the portfolio back in 2008. This again stresses the importance of having a diversified portfolio. It also highlights how a well performing stock can help mitigate some of the damage caused by losses in other areas of one's stocks portfolio.


