Suncorp Group Ltd (AX:SUN) Chart Review - Monthly Chart NB: Charts prepared before the close of 19/12/16.
Suncorp Group shareholders have something to cheer about this Christmas in 2016, after several years of slow declining prices Suncorp Group looks set to finally close above its 2year downtrend.
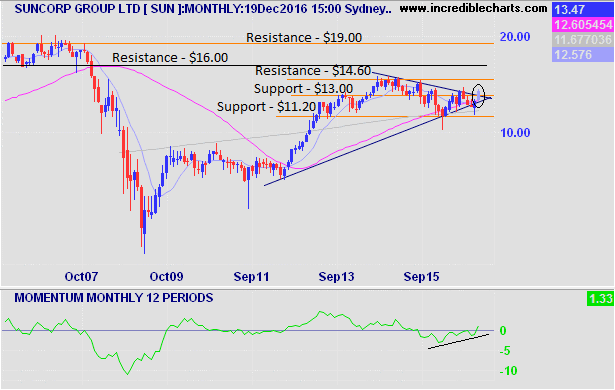
For this chart review I have pulled the data over a much longer period than usual (Hence chart appearing condensed) to give you a good overview of the performance of this stock since 2007, together with some longer term resistance levels.
The first initial thoughts are that you will notice that the stock has still not recovered from its 2007 highs around the $19 a share range. On the positive side after collapsing in 2008 and 2009 to a low of around $4 a share, the stock like the overall Australian stock market has made a strong recovery albeit not at new all-time highs at $13.47.
Supporting Long Term Trend
Suncorp is showing a strong and healthy uptrend since making the lows in 2009. You can see there were a few unsuccessful attempts to close below the uptrend only to recover during the month.
After a few years of a consolidation within the bigger 9 year uptrend, Suncorp appears to be making a breakout higher with its first close above its 2 year downtrend. (See circled area on chart)
The first level of resistance for Suncorp now after breaking past $13 level this month is $14.60 resistance. With the strong momentum this month and usual bullish tendency of December trading month there is a good chance Suncorp may reach the $14.60 area with only a few weeks left in the month.
Since its the 19th of December with a little under 2 weeks to go, there is a potential possibility that Suncorp retreats and falls back within the downtrend line. Given the bullishness of both the US and Australian markets this month this scenario is only a remote possibility.
Lastly having shown a longer period for this monthly chart you can see that there are still several levels of resistance for Suncorp to clear before reaching its previous all time highs. After the near term resistance of $14.60 there is $16.00 a share as well $19 a share to reach before it can begin to attempt new all-time highs.

Weekly Chart
The Drought Has Ended
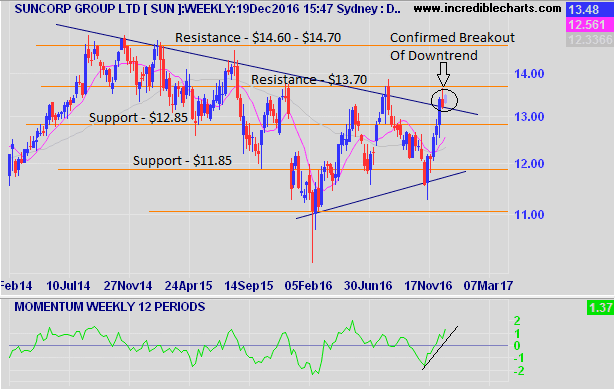
Three weeks ago Suncorp was able to finally break its long term down trend on the weekly chart with a confirmed close above its downtrend. (See circled area below)
Prior to the break out Suncorp had been experiencing a long term downtrend since late 2014, as the stock failed to make higher highs. After reaching the lows of the year at $10.11 in February the stock has been able to make a staged recovery.
With momentum rising for several weeks, the move higher over the last 6 or so weeks has been well supported by strong momentum indicating strength behind the rally higher.
Suncorp is now fast approaching its next level of resistance at $13.70 with around 20c to go before reaching the level. The stock make initially struggle at this level as the previous two attempts failing to move higher. Therefore the $13.70 level is a critical price point for Suncorp over the last few weeks of the year. A failure to close above the next resistance level could see the stock fall back to $12.85 level of support.

Daily Chart
Trump Effect
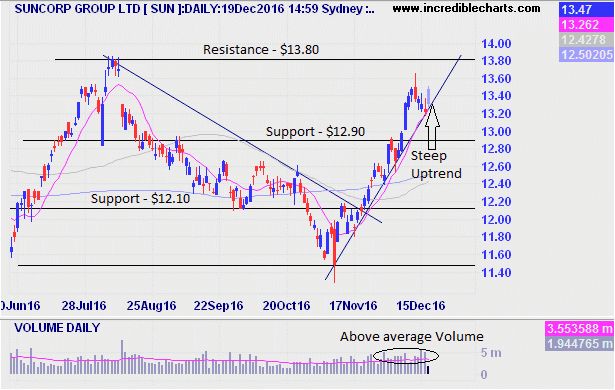
Since the day of the US election when the news of Trump winning shocked the markets into freefall temporarily, Suncorp has been able to enjoy a spectacular move higher for a alrge cap stock. After closing at $11.47 on the 9th of November the stock has rallied $2 a share or over 17% in a 6 week period.
Due to the fact that the rally has been so strong the daily chart uptrend is quite steep. (See chart below) The reason why I'm mentioning the steepness of the trend is because the steeper the move of a trend the shorter the trend normally lasts. This is because buyers quickly disappear with such a large move forcing the price to fall violently on most occasions.
Warning:
I suggest to wait for a retracement / pullback in price before considering this stock due to the very strong run up over a short period. I have drawn in the uptrend line to carefully watch for a reversal to occur.
Given that volume has also been above average which is a very bullish sign, Suncorp most likely will reach the $13.80 resistance level first before experiencing a pullback in price.
Overall Suncorp looks very bullish on all 3 time horizon charts following the big banks higher in the month of December. I have indicated the resistance and support levels to watch out for over the next couple of weeks.
Lastly be mindful of any sharp increases in volatility over the holiday period we are entering into now with low volume over the holidays the markets can move erratically.
Back in the last week of December last year and the first week of January 2016 the markets had the worse start of the year, after the FED raised interest rates in December 2015, just like they have in 2016.

Disclaimer: This post was for educational purposes only, and all the information contained within this post is not to be considered as advice or a recommendation of any kind. If you require advice or assistance please seek a licensed professional who can provide these services.
