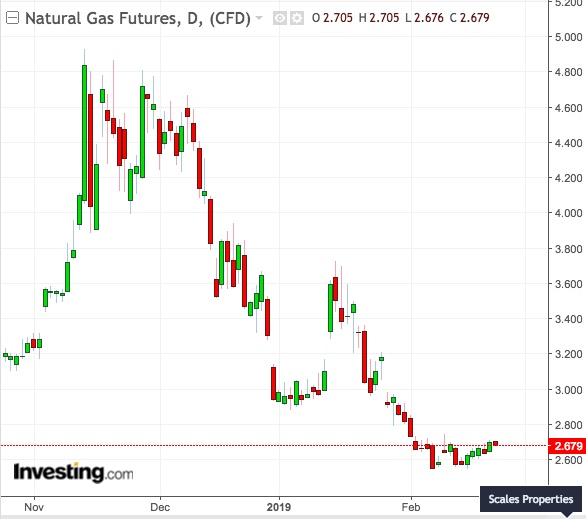
Natural gas bulls may have hope for $3 pricing after all.

A late bout of February cold, initially dismissed by analysts, led to blowout consumption of gas for heating last week, prompting revisions to what demand in March could be as the 2018-19 winter proves more stubborn than thought.
It’s About Where Storage Is Going
Dan Myers, analyst at Houston-based gas market consultancy, said:
“It is not about where storage is now but where it is headed in the coming weeks, and right now storage is on a path that could take it more than 25 percent below the five-year average before the end of the withdrawal season.”
The U.S. Energy Information Administration reported on Thursday that utilities withdrew 177 billion cubic feet of gas from storage for the week ending Feb. 15, above the 165-bcf forecast by the market. The pull was also higher than the 134-bcf seen during the same week a year ago and above the 148-bcf withdrawal recorded for the five-year average.
Last Week’s Draw Atypical For Late Winter
Dominick Chirichella, director of risk and trading at the Energy Management Institute in New York, said the 177-bcf consumption was “atypical for this time of year”.
He said over the next few days, below-normal temperatures will be making it into the U.S. Midwest and Northeast, keeping the North-Central U.S. belt—which relies heavily on gas-fired heating—colder than usual.
The most-actively traded gas futures on New York’s Henry Hub, April, settled Thursday’s trade up 5.5 cents, or 2.1 percent, at $2.724 per million metric British thermal on the bullish gas draw reported by the EIA.
Henry Hub’s spot contract, March, closed up 6.1 cents, or 2.3 percent, at $2.697.
Chirichella thought the market has a shot for going higher, both fundamentally and technically.
Low Temperatures Have To Stick Around
Weather wise, he said, low temperatures “will have to remain in play for prices to breakout to the upside, and push toward the psychological $3 per mmbtu threshold”.
From a chart perspective, the market was
“approaching the upper, resistance end of the 13-day sideways trading range. The current technical trading range boundaries for March remain at $2.541 on the support side and $2.737 on the resistance end.”
He added:
“I am maintaining my Nat Gas view and bias at cautiously bearish as the market is near the technical range support level.”
'Strong Buy' Recommendation
Technical analysts on Investing.com have “Strong Buy” recommendation for March gas in their daily outlook. A sell call only emerges if the contract moves up from its current 20-Day Moving Average to the 50-DMA of $3.023 and beyond.
Myers noted that it was important for the trade to keep a check on its bullish projections to prevent another misstep like last week when bearish ideas prevailed.
Even so, he added:
“The demand-boosting cold shaping up in early March puts the end of season storage total at additional risk and will soon force the market out of its apathetic state if it materializes as expected.”
“Relatively strong withdrawals going into March are expected to expand the storage deficits in the coming weeks.”
