- Analysts' annual tradition of predicting the S&P 500 for 2024 has kicked off, but history shows forecasts are often detached from reality.
- In this piece, we will examine the potential impact of a +20% or more gain in the S&P 500 in 2023 on the subsequent year, with positive trends in 65% of cases.
- Current market dynamics, including shifts in laggards becoming leaders and broader participation in the rally, suggest ongoing momentum and significant upside in the S&P 500.
It's that time of the year when analysts make predictions for the S&P 500 index in 2024 using crystal balls and setting targets. As is often the case, these forecasts end up being detached from reality and, consequently, quite inaccurate.
For instance, Goldman Sachs (NYSE:GS) has been notably incorrect in crucial years, particularly in 2000 and 2008. Recalling their overly optimistic stance, analysts provided S&P 500 forecasts for the last two years, with an initial highly positive target of 5100 by the end of 2022.
They suggested that 2023 would be a transitional year with a conservative target at 4000 points. However, reality turned out quite differently.
The target game—because that's essentially what it is, given the inherent difficulty in making accurate predictions—is now an annual tradition among analysts. So, here's the first optimistic indication for 2024.
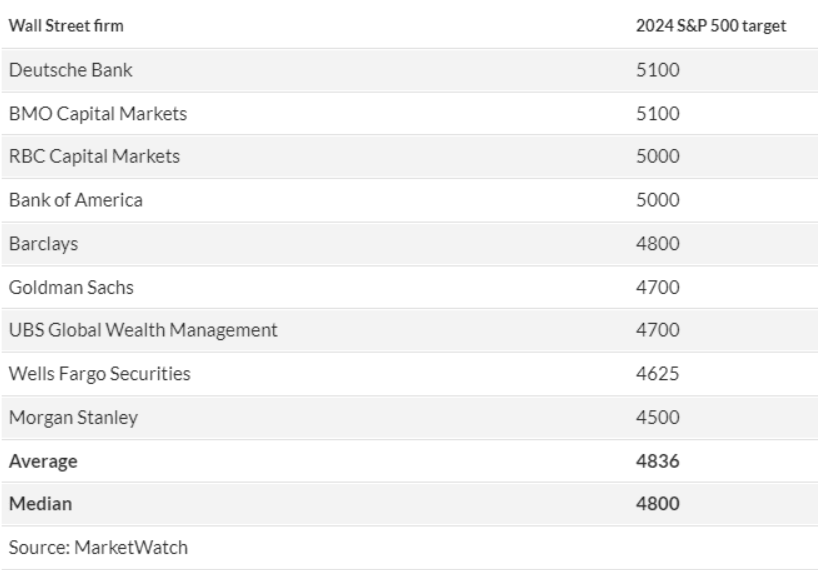
What Will Next Year Look Like?
The reality is that no one has the foggiest idea, as they should, but we can make plausible assumptions on the data we have available to us. It may give an idea to study historical stock market returns, certainly, it will not help us predict the future but it helps us better understand the performance under certain conditions or targets reached.
From 1928 to the present, there have been 34 years in which the S&P 500 has risen by 20 percent or more while if we see the total declines, the years are reduced to 26. This means that the stock market has recorded strong rises (+20%) with more than 30% compared to declines, and the average loss has been about 13% (in bearish years). More specifically, if the S&P 500 closes 2023 with +20% or more, let's see how equities have performed (historically) the year after: 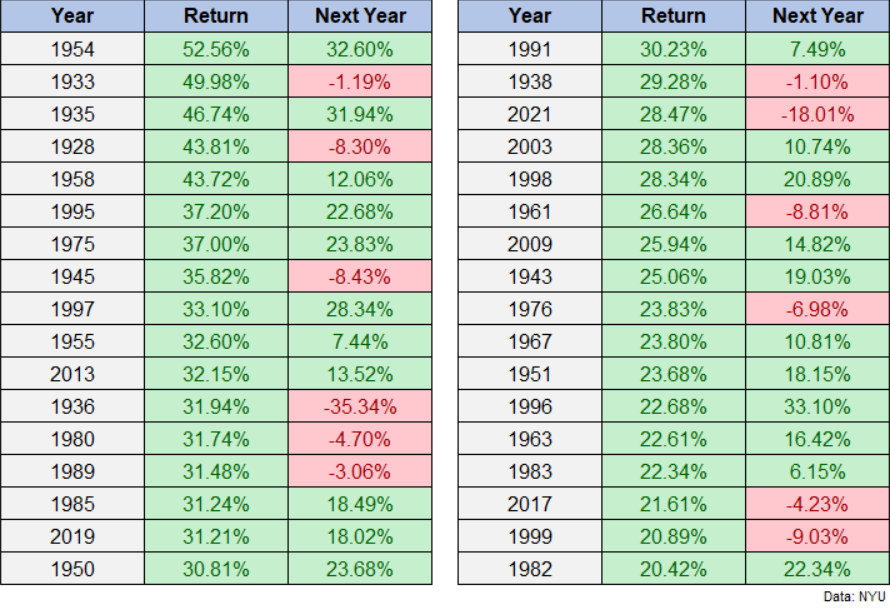
In the 34 years of rises of 20% or more, the stock market also performed positively in the next 22 years (65%) while it went down in the next 12 years (35%) and the average next year total return (over the 34 years) was 8.9%.
Furthermore, taking only the subsequent positive years the average return was +18.8% while in the negative years alone the average decline was -9.1%. Finally, there were only 2 years with double-digit declines, 1937 and 2022.
Currently, the S&P 500 is close to +20%, We will see whether the Santa Claus rally will come or not.
Meanwhile, as we all know, this year's 2022 laggards have become the new leaders but in recent weeks things are changing, we are seeing a reversal in industrial, financial, and small-cap stocks. 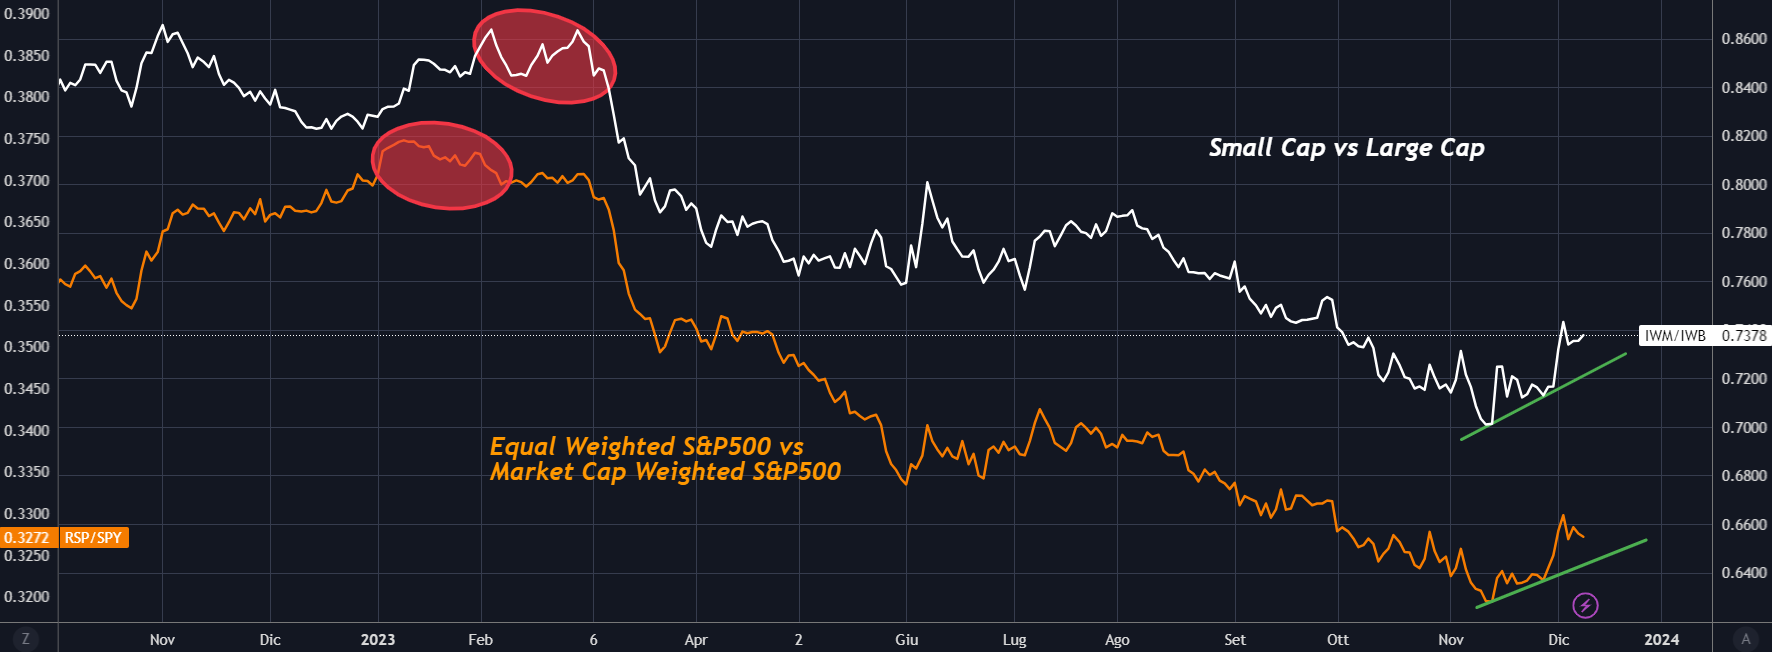
Looking at the chart the strong trends of over a year are changing, and this may be the participation the market needs to fuel the new year rally. Confirming the trend, according to Goldman Sachs data, hedge funds have been selling off the Magnificent 7 in recent weeks by moving into other stocks:
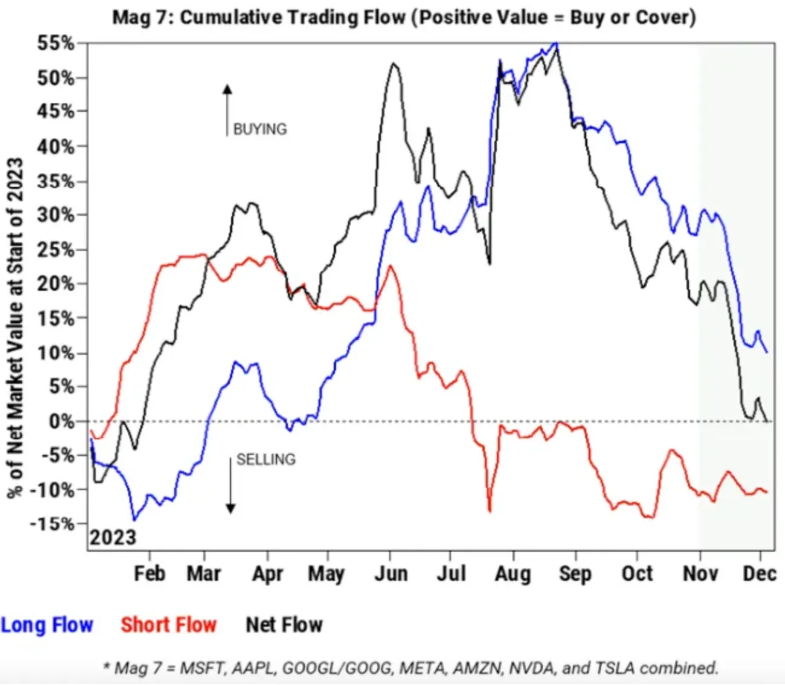
Furthermore, the 80 stocks, constituting 16 percent of the S&P 500, have reached their 52-week highs. This serves as an additional bullish signal, indicating that a greater number of stocks (beyond the Magnificent 7) participating in the ascent contributes to better-sustained upward momentum in the long run. As a result, the 493 stocks comprising the S&P 500 could play a role in propelling the rally to new all-time highs.
Conclusion
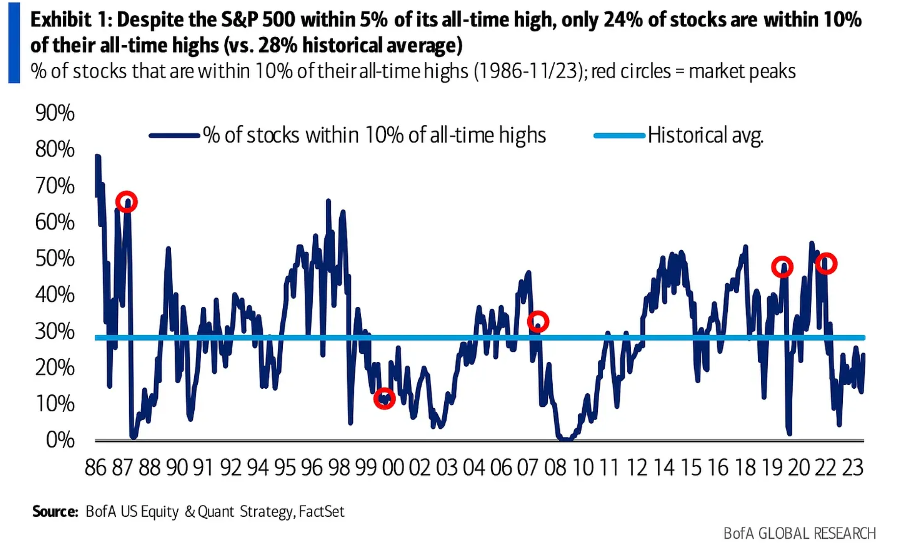
According to BofA, only 24 percent of the stocks are near their all-time highs (-10 percent), and this represents lower than the historical average of 28 percent and the index's previous peaks. Thus, it represents a clear signal that we are not close to any peak in the S&P 500 and that there could still be significant upside in the coming months.
You can easily determine whether a company is suitable for your risk profile by conducting a detailed fundamental analysis on InvestingPro according to your criteria. This way, you will get highly professional help in shaping your portfolio.
You can sign up for InvestingPro, one of the most comprehensive platforms in the market for portfolio management and fundamental analysis by clicking on the banner below.
Disclaimer: This article is written for informational purposes only; it does not constitute a solicitation, offer, advice, or recommendation to invest as such it is not intended to incentivize the purchase of assets in any way. I would like to remind you that any type of asset, is evaluated from multiple points of view and is highly risky therefore, any investment decision and the associated risk remains with the investor.

