-
Cryptocurrency markets are facing continued pressure, with Bitcoin dipping below $65,000, testing key support levels.
-
Ethereum shows resilience around $3,300, buoyed by SEC-related optimism, while Solana struggles amid persistent selling pressure.
-
Fetch.ai token has surged due to increased demand and anticipation of its upcoming merger, standing out against the broader market weakness.
-
Invest like the big funds for under $9/month with our AI-powered ProPicks stock selection tool. Learn more here>>
Cryptocurrency markets remain under pressure, extending their downward trend into the new week. While there have been some tentative buying attempts near recent lows, overall momentum remains negative, with no clear sign of a reversal yet.
Bitcoin dipped below $65,000 this week, revisiting its lowest level since mid-May. Buyers are struggling to defend the key support zone that has held for the past month, raising concerns about a potential deeper decline. Bitcoin's main rival, Solana, continues to experience selling pressure and has fallen further in recent days.
Ethereum, on the other hand, has shown some resilience in the recent downdraft. It continues to find support around the $3,300 level, which emerged last week. However, Solana, Ethereum's biggest competitor, continues to bleed value.
In a bright spot for the market, the Fetch.ai token (FET/USD), which is associated with artificial intelligence (AI) applications, has seen a surge in demand this week. This stands out against the broader market weakness and could be related to its upcoming merger with two other crypto assets next month.
1. Ethereum: Correction About to End?
Ethereum bulls got a much-needed boost this week, thanks to news from the SEC. Following the ETF approval in May that sent prices soaring towards $4,000, Ethereum faced profit-taking in June, leading to a price decline.
However, the SEC's recent closure of the Ethereum 2.0 filing was met with optimism by the Ethereum community, triggering renewed buying around $3,300. This move by the SEC is seen as a positive indicator for potential ETF trading approval in July, further bolstering bullish sentiment for ETH.

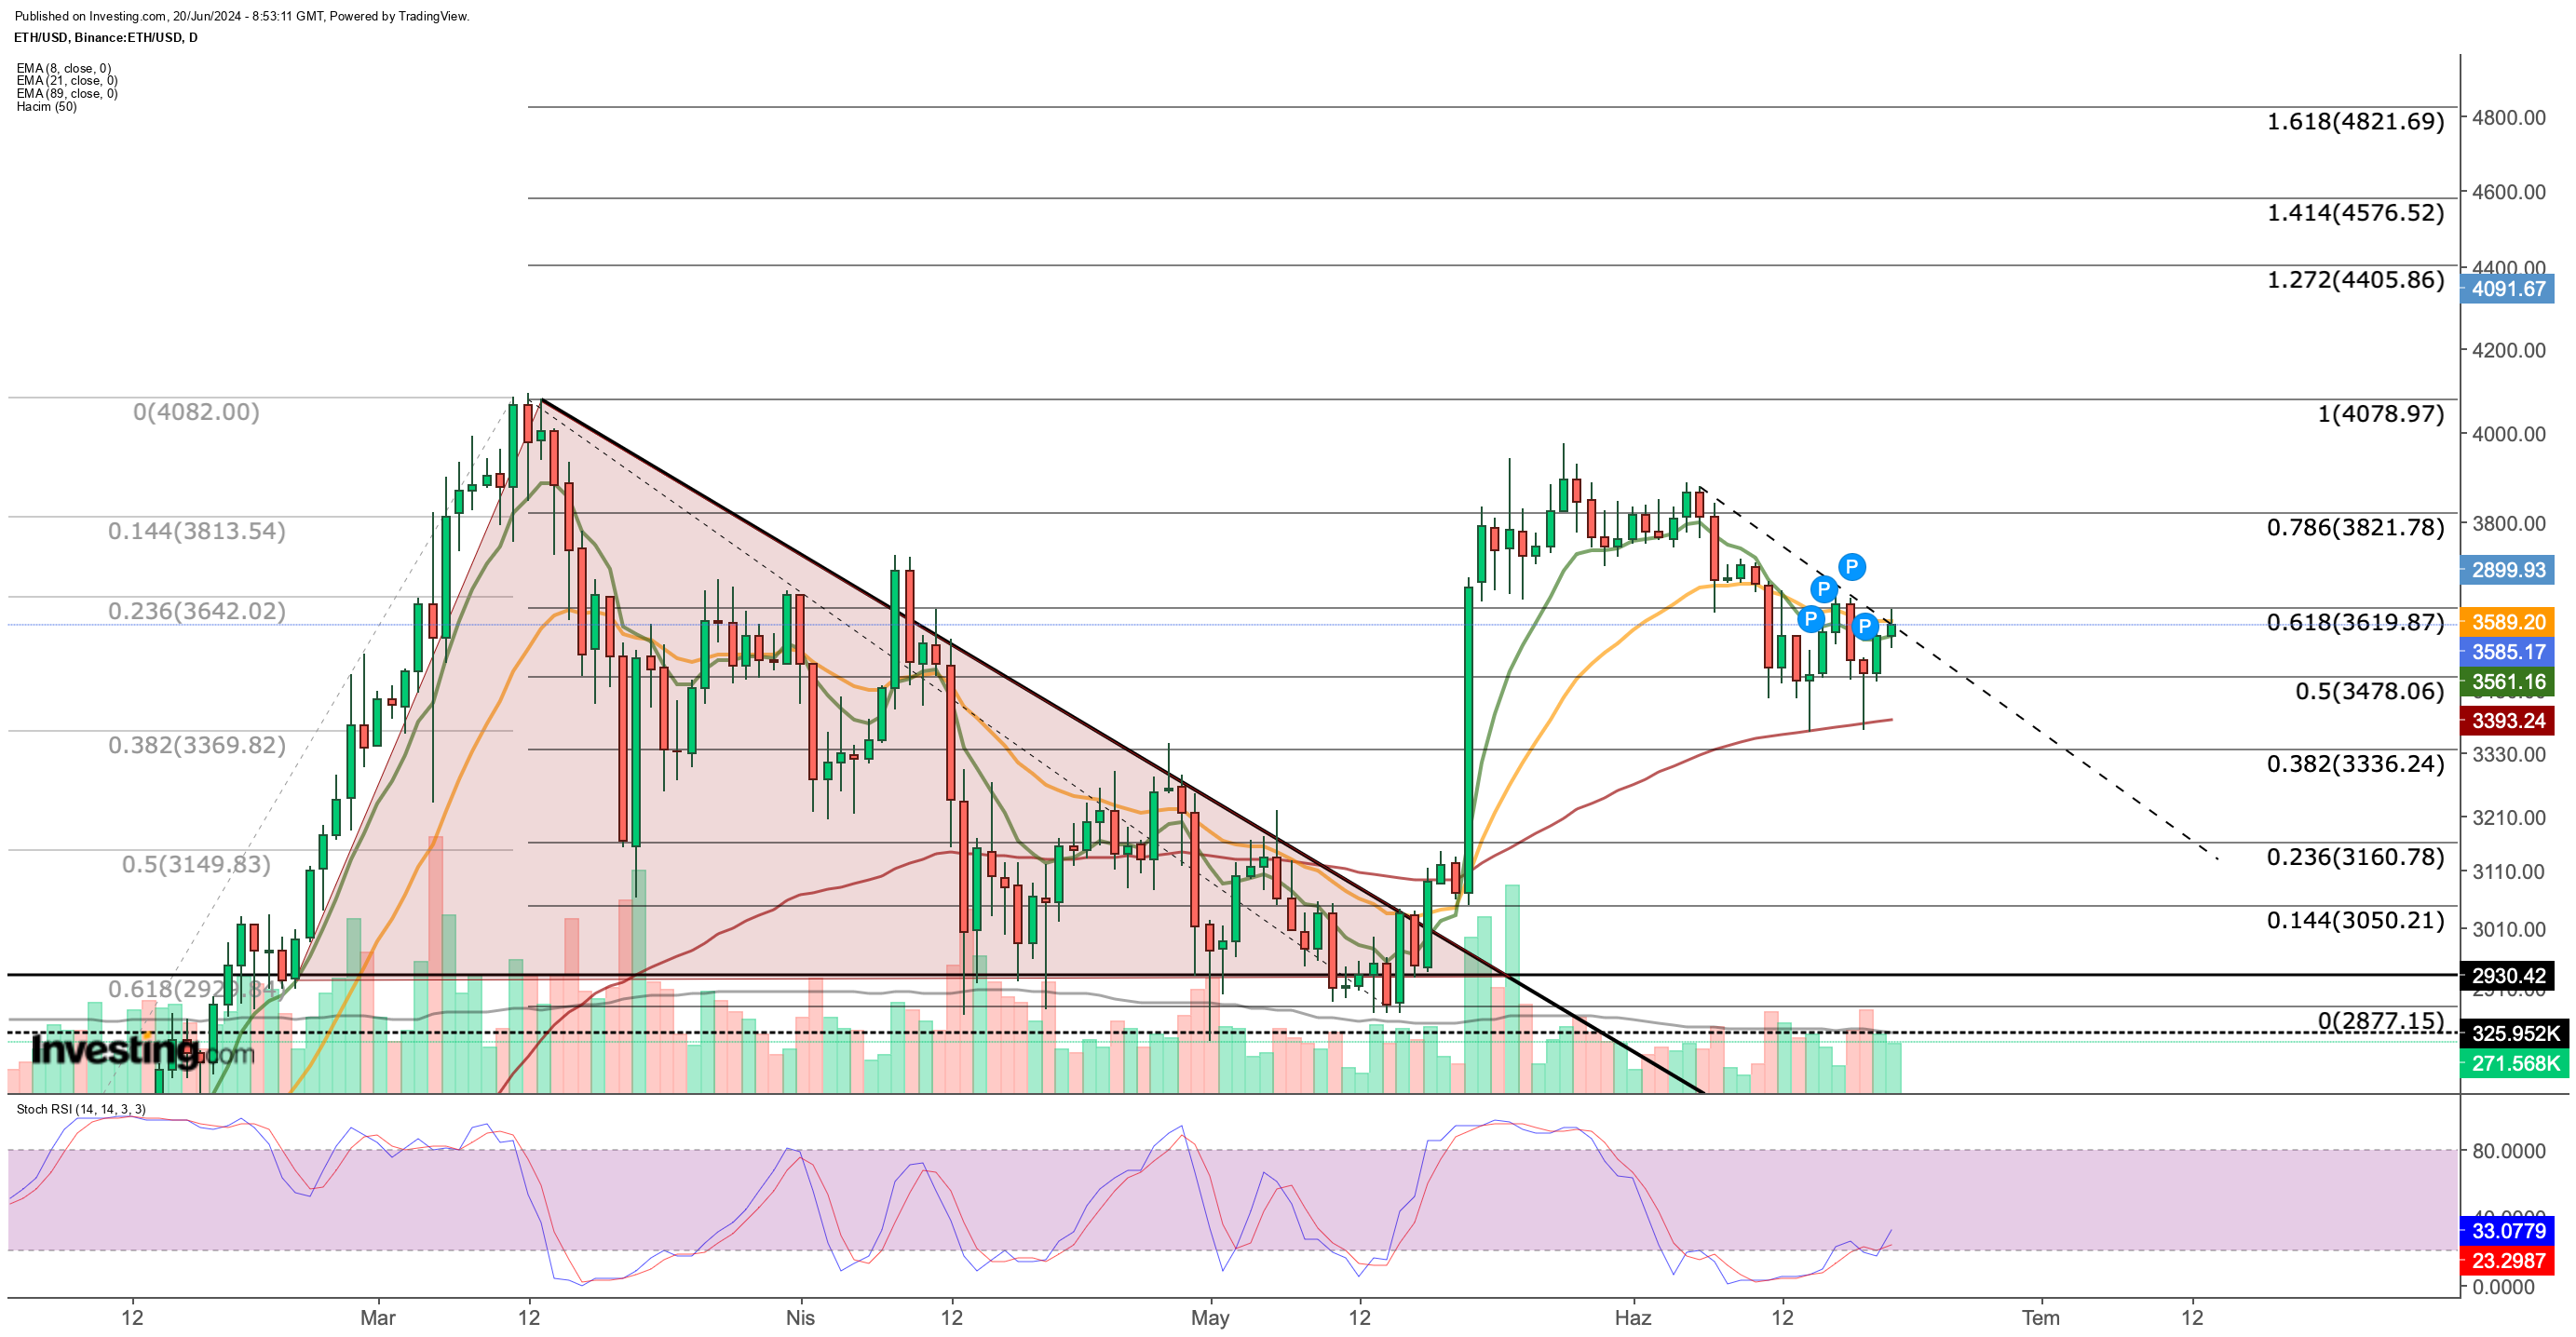
Examining the daily Ethereum chart, we see a clear slowdown in the correction since June 11th, with daily closes consistently above $3,450. Over the past two days, Ethereum has exhibited positive momentum.
In the short-term, the $3,560-$3,590 range acts as a key resistance zone. Surpassing this area opens the door for a potential test of the $3,620 level, which hasn't been breached since last week and previously served as the upper limit of the short-term horizontal movement.
A sustained close above $3,620 for a week could trigger an acceleration towards $3,820, a crucial level for the continuation of the uptrend. A break above this level could see Ethereum surpass its 2024 peak and potentially initiate a move towards the $4,400-$4,800 price zone.
On the downside, the $3,400 level serves as critical support to prevent a steeper decline. This level coincides with the 3-month EMA, which Ethereum has tested twice in the past week. A daily close below this average could trigger a surge in selling pressure, potentially pushing ETH back down to the $3,000-$3,100 range.
Overall, considering the current support levels, the odds appear to favor a potential upside move for Ethereum.
2. Solana Tumbles: Is a Rebound in Sight?
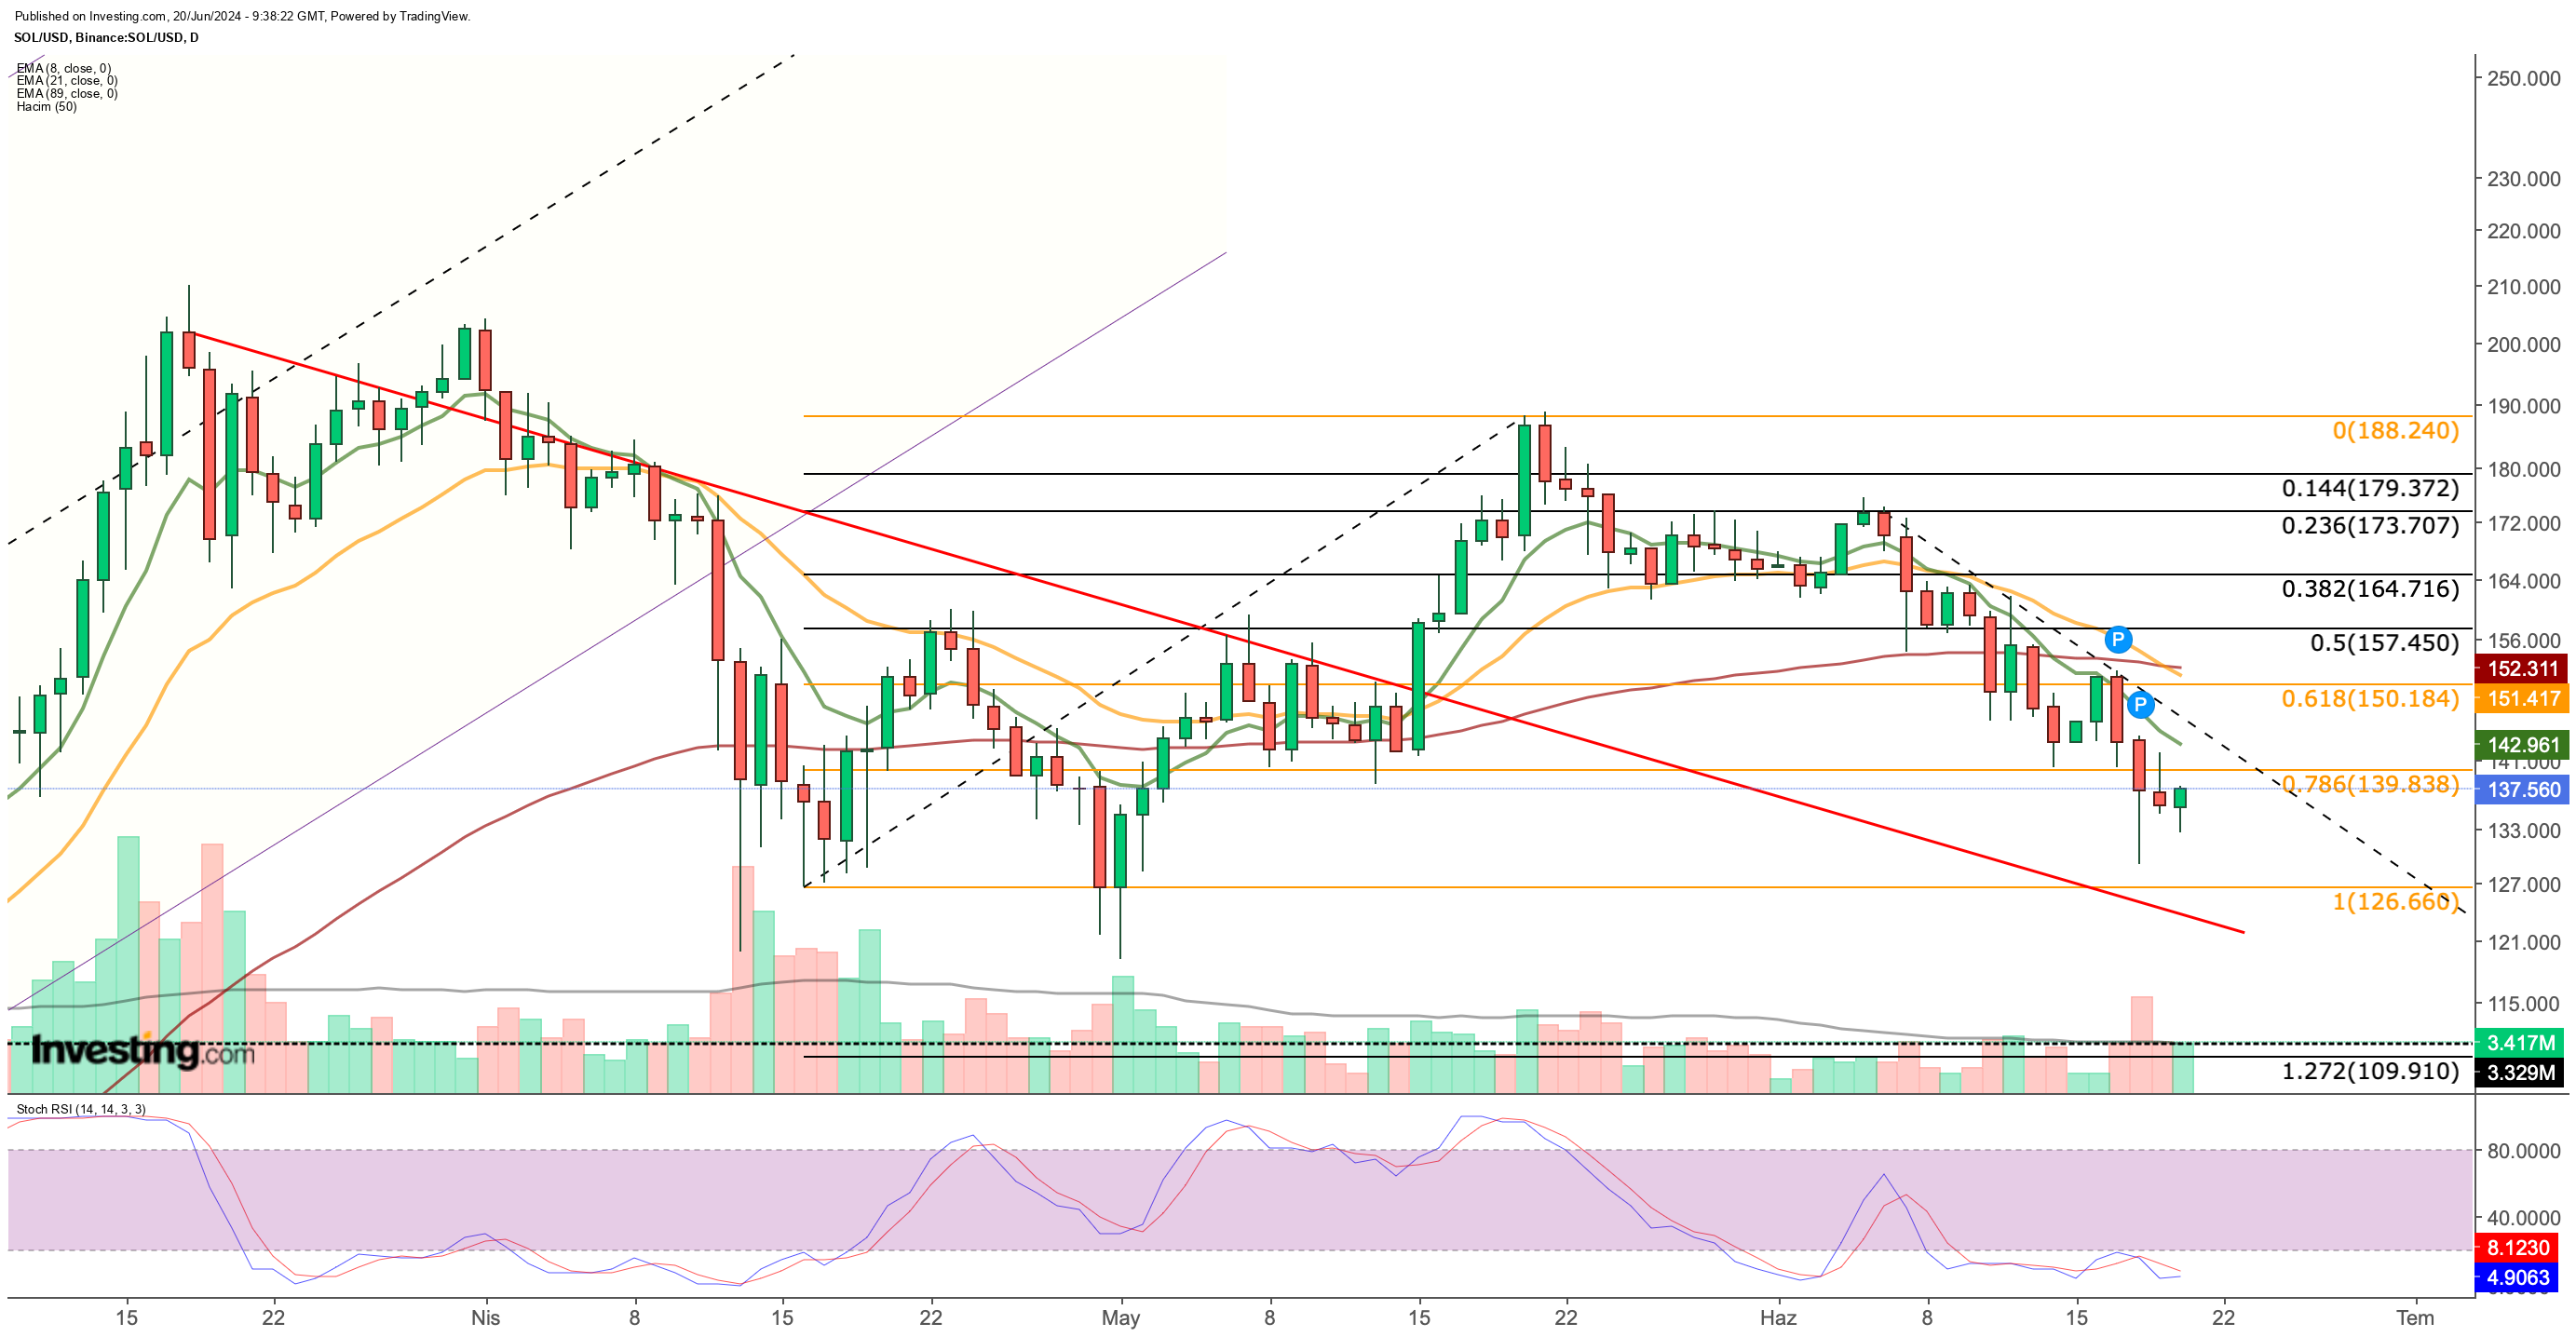
Solana's recovery attempt in late May stalled around $180, with sellers pushing the price down to initial support at $165 (Fibonacci retracement level of 0.382). This support held for a while, but continued selling pressure dragged Solana below the stronger $140 support (Fibonacci retracement level of 0.786).

Looking at the technical indicators, the short-term EMAs on the daily chart are poised to cross below the 3-month EMA, which historically suggests a potential continuation of the downtrend. Additionally, the Stochastic RSI remains flat in oversold territory, failing to indicate an imminent rebound.
These signs suggest further selling pressure on SOL as long as it stays below $140. A potential downside target could be $126 support, a level that previously marked a trend reversal in April. If this level breaks, SOL could plunge towards the $100-$110 range.
However, a weekly close above $140 could signal easing selling pressure. This, contrary to the current technical outlook, could spark some hope for a rebound. For a short-term recovery, a break above $150 could be the first key hurdle to overcome.
3. FET Soars on Renewed Merger Hopes
FET (Fetch.ai) soared in price after a surprising announcement: a delay in the highly anticipated merger of three major AI tokens - FET, OCEAN, and AGIX. This first-of-its-kind alliance initially sent all three tokens skyrocketing back in March.
The merger, under the banner of Superintelligence Alliance (ASI), was originally scheduled for launch on June 11th. However, developers announced a postponement to July 15th, causing a temporary dip in FET's price.

Reassuring statements from the developers regarding the merger's progress, combined with a supportive announcement from Binance, quickly reversed the downtrend. Investors, eager to accumulate ASI tokens before the official merger, are also fueling the rise in FET's price.
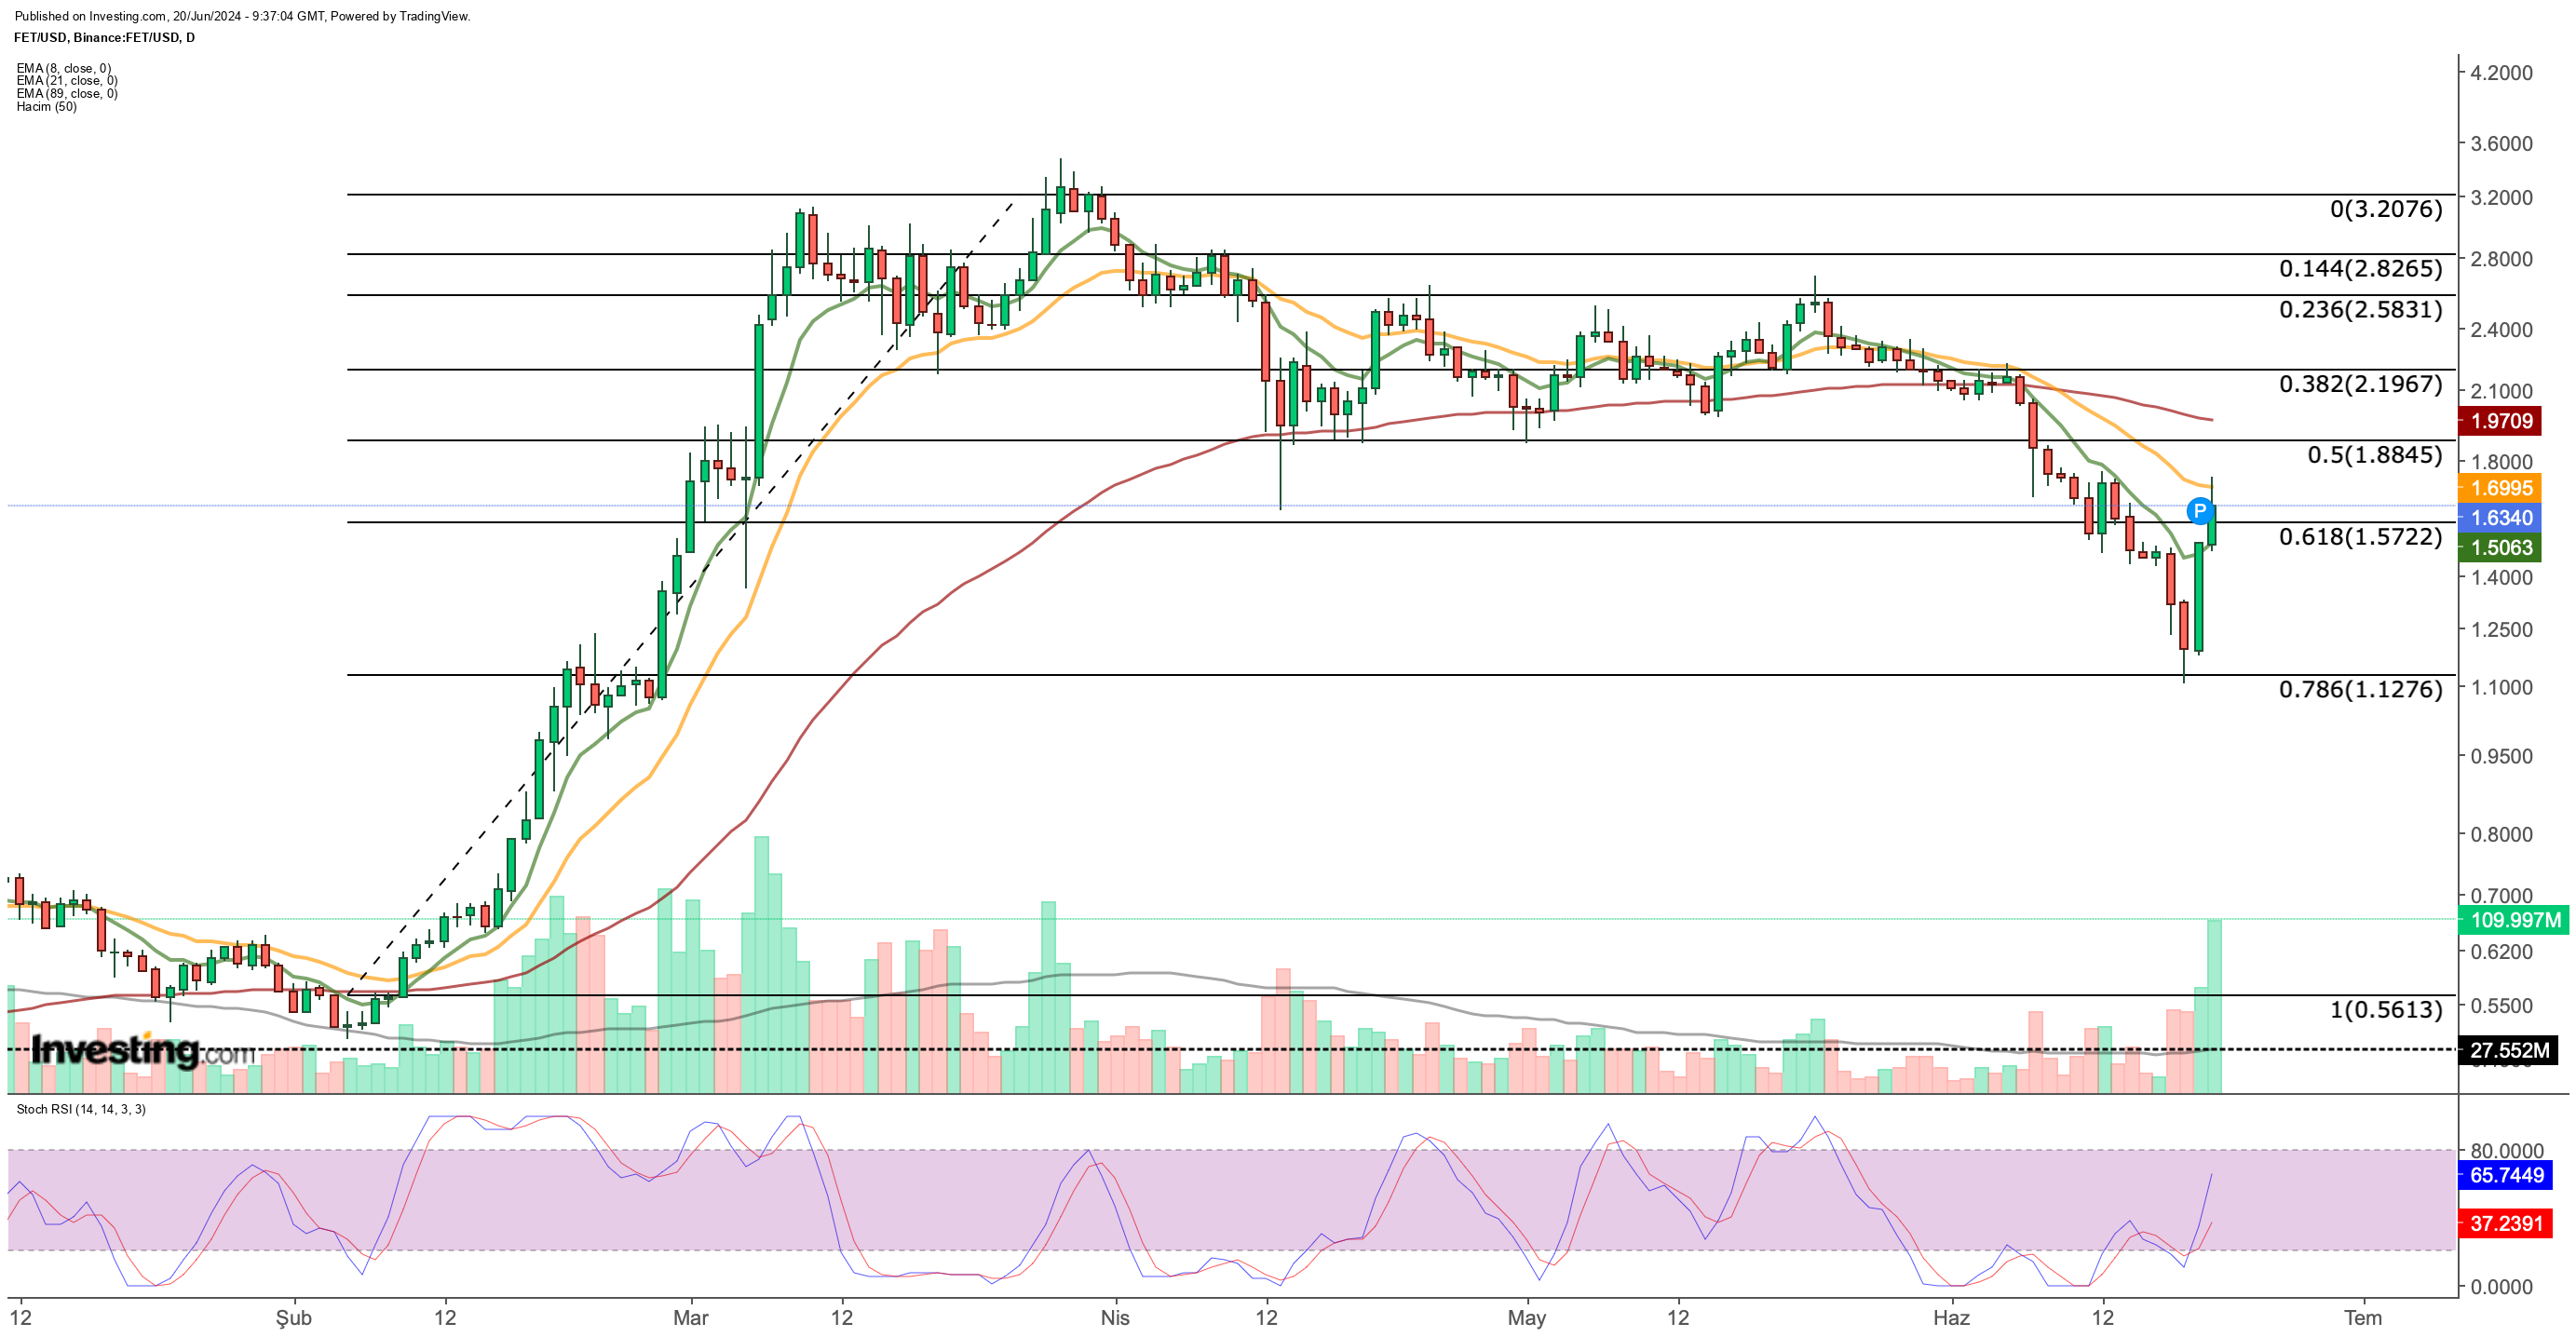
Technically, FET found support at a key level after a significant drop earlier in June. This, along with the upcoming merger, has propelled the price back above $1.57. If the momentum continues, analysts predict a potential rise to $1.9 or even $2.4-2.7 before the official merger date.
However, the next month remains volatile. Negative news surrounding the project could trigger a rapid decline, potentially pushing the price below $1. Investors should be aware of this risk and consider potential support levels around $0.95 in a bearish scenario.
***
Take your investing game to the next level in 2024 with ProPicks
Institutions and billionaire investors worldwide are already well ahead of the game when it comes to AI-powered investing, extensively using, customizing, and developing it to bulk up their returns and minimize losses.
Now, InvestingPro users can do just the same from the comfort of their own homes with our new flagship AI-powered stock-picking tool: ProPicks.
With our six strategies, including the flagship "Tech Titans," which outperformed the market by a lofty 1,745% over the last decade, investors have the best selection of stocks in the market at the tip of their fingers every month.
Subscribe here and never miss a bull market again!

Don't forget your free gift! Use coupon codes OAPRO1 and OAPRO2 at checkout to claim an extra 10% off on the Pro yearly and bi-yearly plans.
Disclaimer: This article is written for informational purposes only; it does not constitute a solicitation, offer, advice, or recommendation to invest as such it is not intended to incentivize the purchase of assets in any way. I would like to remind you that any type of asset, is evaluated from multiple points of view and is highly risky and therefore, any investment decision and the associated risk remains with the investor.
