Briefly: In our opinion, full (150% of the regular full position) speculative short positions in gold, silver and mining stocks are justified from the risk/reward perspective at the moment of publishing this alert.
In our previous analysis we discussed the silver market viewed from the non-USD perspective and we commented on the possibility of seeing a more visible corrective downswing in the USD after it moved closer to the 96 level. In today’s essay, we would like to further elaborate on the white metal – not only because we saw another sign in the non-USD silver price, but also because we would like to reveal a technique that can tell us when the next reversal in silver is likely to take place.
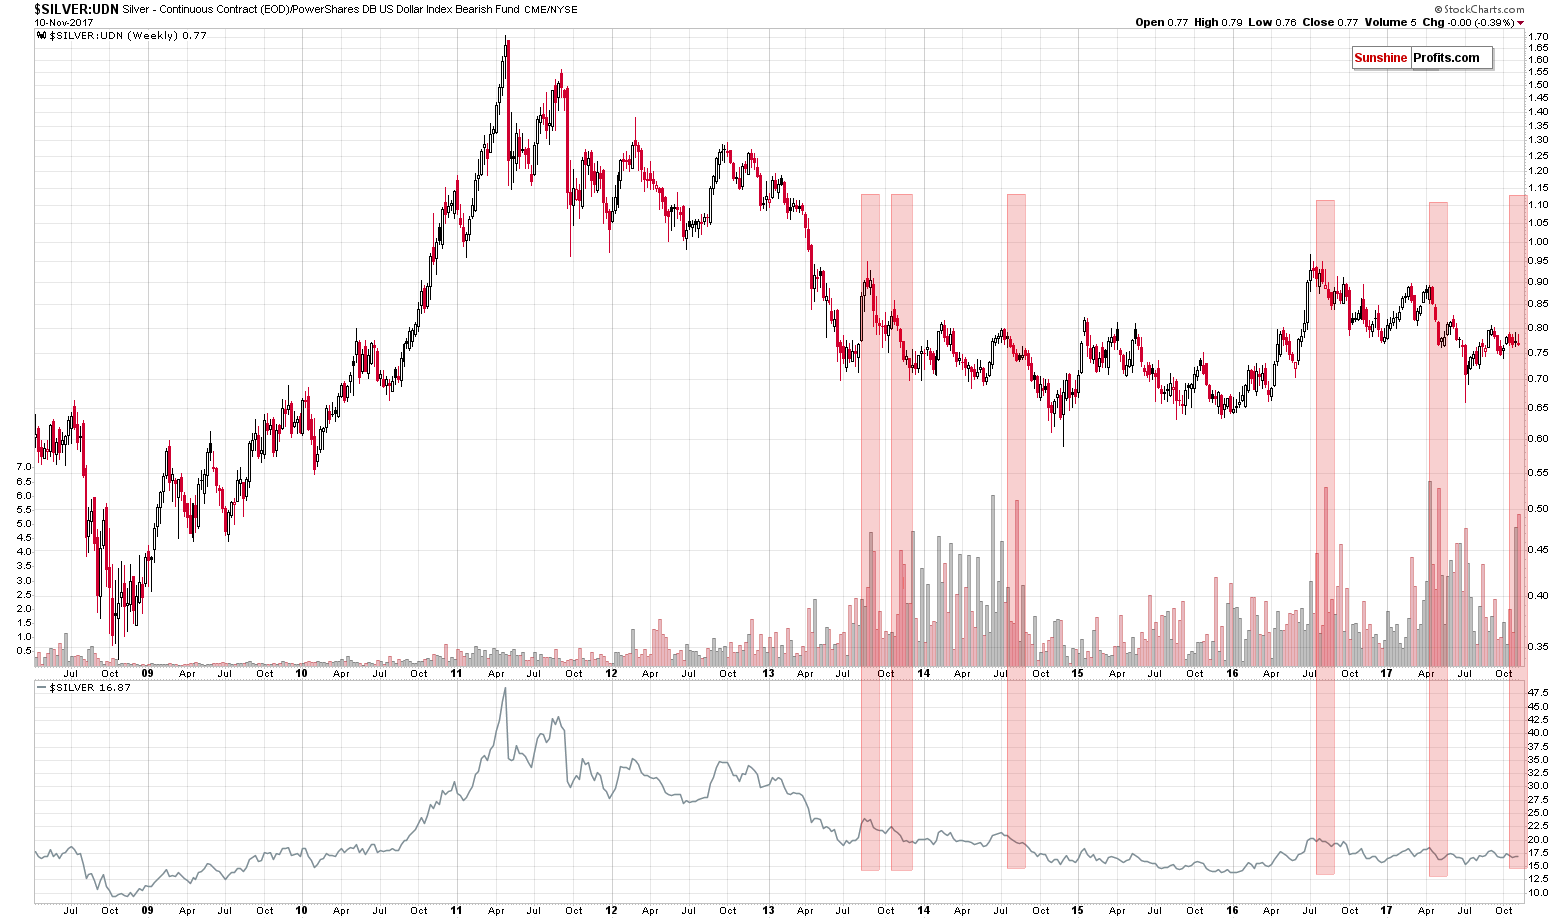
Let’s jump right into charts, starting with the silver to PowerShares DB US Dollar Bearish (NYSE:UDN) ratio (chart courtesy of stockcharts).

This ratio means that silver’s USD price, which we usually analyze, is multiplied by various currency exchange rates (i.e. the EUR/USD) and then these prices are averaged with weights just as in the USD Index.
The thing that’s happening on the above chart is the spike in volume (ratio of volumes). While it may sound esoteric and odd that we’re analyzing the ratio between the volume of silver and one of some ETF, please note that it has significant predictive value.
The huge volume readings preceded major declines (we marked those situations with red rectangles) and since we just saw this signal once again, the implications are bearish. A side note: when we previously commented on the ratio of volumes between silver and UDN, we called it silver’s hidden signal as that’s something that many investors and professional analysts are not aware of.

Let’s stay with silver for a while. In Friday’s alert, we wrote the following:
Silver and mining stocks declined. The Stochastic indicator based on the price of the white metal flashed a sell signal and while mining stocks didn’t fully invalidate the move above the rising support/resistance lines, their underperformance relative to gold is a strong bearish sign anyway.
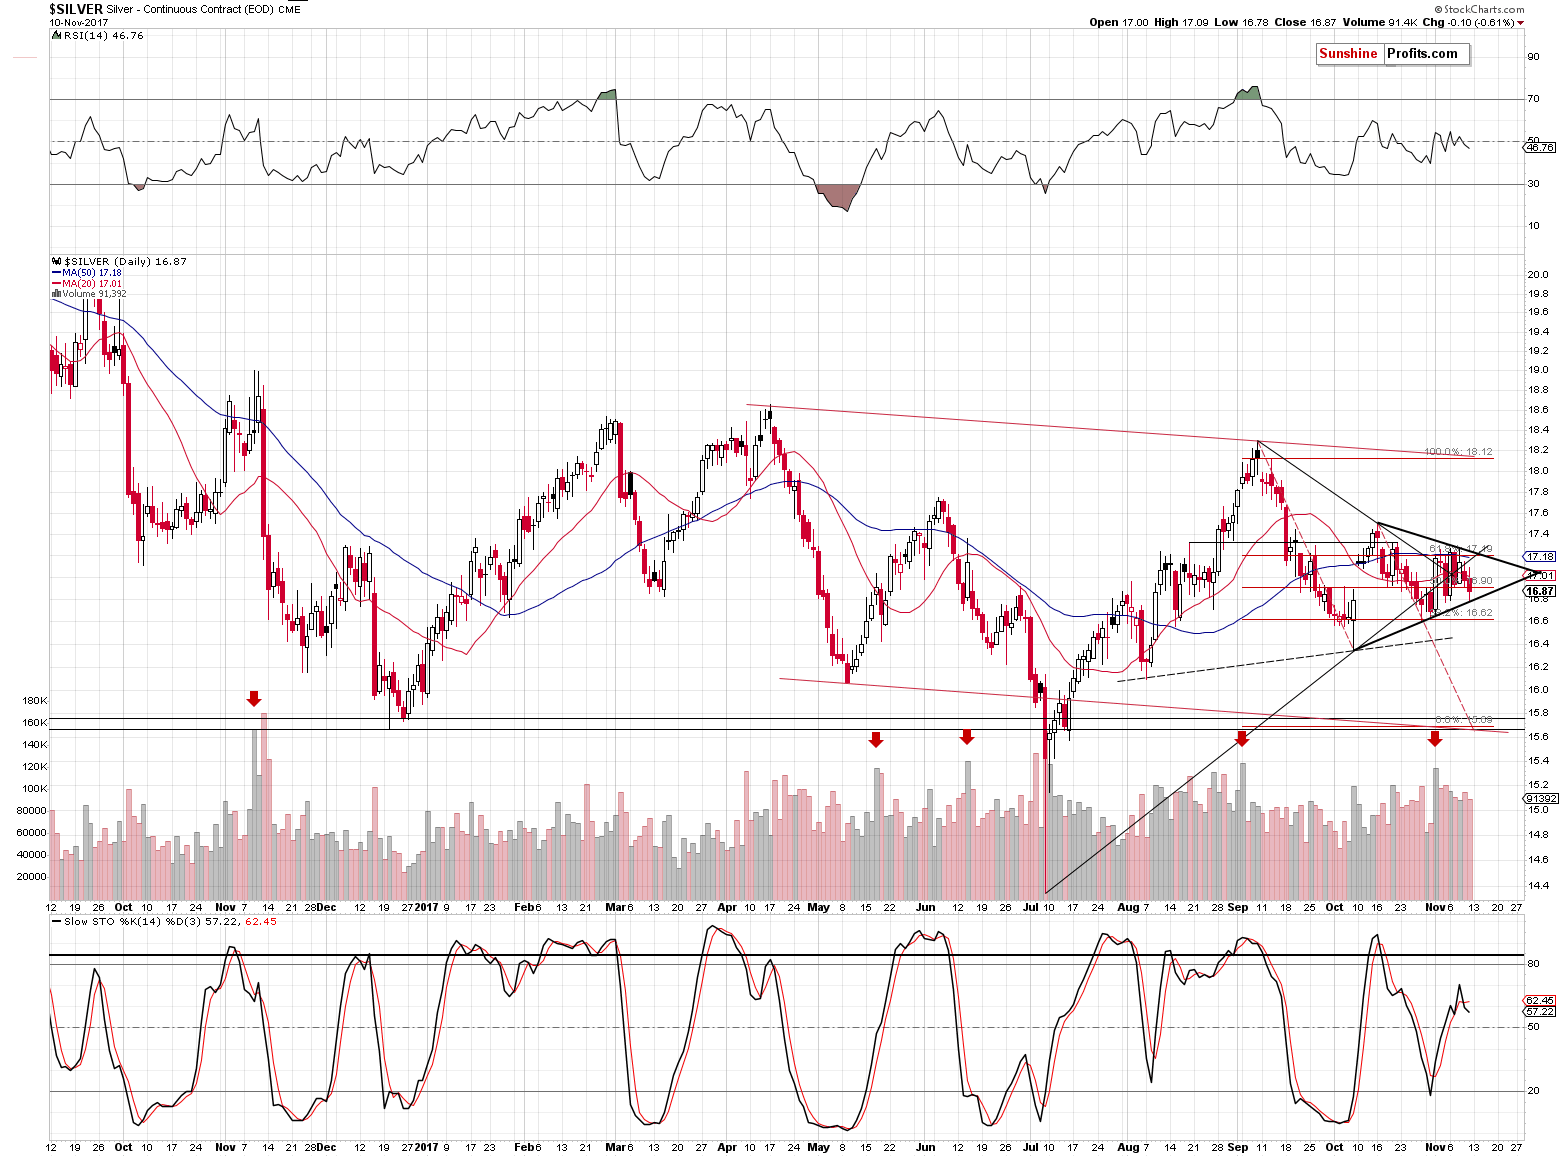
Speaking of silver, please note that it seems to have reversed according to the apex technique that we described about a month ago:
Let’s move back to the HUI Index chart once again as it features a new technique that we’ve been validating for the precious metals market and it finally seems that it’s justified to include it in our set of tools. The technique is the triangle apex reversal. The technique is quite straightforward and even though it may appear somewhat random (it mixes both price and time), it works surprisingly well.
Moving to the point, the triangles are usually drawn in order to create support and resistance levels, check whether a breakout or breakdown is more likely and estimate the likely size of the move that follows the breakout or breakdown. However, if one continues to draw the triangle borders until they cross, they will get a quite precise time target. You can see the above in action on the HUI Index chart. The triangle’s apex is a bit below 185, in early September. The former is irrelevant, but the time wasn’t. The HUI Index indeed topped in early September.
We noticed that the more visible the triangle is and the greater number of extremes confirm its existence, the more reliable the prediction for the turning point becomes.
In silver’s case, the technique pointed to a reversal on November 6th and that was indeed when we saw the high in terms of the daily closing prices.
There are two reasons for quoting the above:
- The sell signal from the Stochastic indicator is even clearer based on Friday’s move lower, so the implications are bearish. In fact, there were only three other cases visible on the above chart when the Stochastic flashed visible sell signals (moving below its red signal line) while not being above the 80 level, but below it. They all were followed by very sharp declines: the late September 2016 signal was followed by a sharp slide in early October, the mid-November 2016 signal and declines are clearly visible and the same goes for the late-June 2017 decline that temporarily took silver below $15. Naturally, the implications are bearish.
- We created another triangle on the above chart based on the recent extremes (marked with thick, black lines) and its apex points to a reversal in early December – that’s something definitely worth keeping in mind.
Summing up, it seems that silver is going to decline significantly in the coming weeks and months, but we should not be surprised by an interim corrective upswing (possibly triggered by a reversal in the USD Index when the latter moves close to the 96 level). The awareness of a specific turning point in the first days of December is something that will become particularly important once we get closer to this date - it will be very useful in connection with the direction in which silver will move in the final part of November.
