It was a low-key speech delivered by a crop academic in Texas, the second smallest wheat growing state in the US. But in outlining his case for wheat in 2019, Texas A&M agricultural economist Mark Welch also explained why US farmers might not go wrong in planting all they could of this year’s second-best performing commodity.
While the typical story in commodities is the more the production, the weaker the price, in wheat’s case, output isn’t matching planting efforts due to weak crop yields. And, Welch said, incredibly, the story was the same almost anywhere in the world wheat was grown.
Wheat Demand Outpacing Supply Across The World
In his address to the Texas Wheat Producers’ Symposium, reported by the Waco Herald-Tribune on Saturday, Welch said:
“When it comes to the fundamental factors driving prices on wheat, we have a very strong demand base, in that the consumption of wheat continues to grow around the world. And, we had a smaller crop in 2018, so production relative to the consumption patterns got tighter.”
Welch said that meant that the United States, which accounted for only 8 percent of global wheat supply despite being ranked the fourth largest for the grain with 55 million metric tons of annual output, had to increase its acreage along with its competitors in the coming year. For 2018, the US Department of Agriculture has forecast global production at 733 million metric tonnes, the lowest in five years, or down 3 percent from the 2017/18 record high.
According to Welch:
“We’ve seen global wheat prices higher in the last several years. So, the signals and incentives are there that they need to plant more wheat too. Their yield prospects and their export potential, as it unfolds over the year, will be very important.”
Second Best Performing Commodity After NatGas
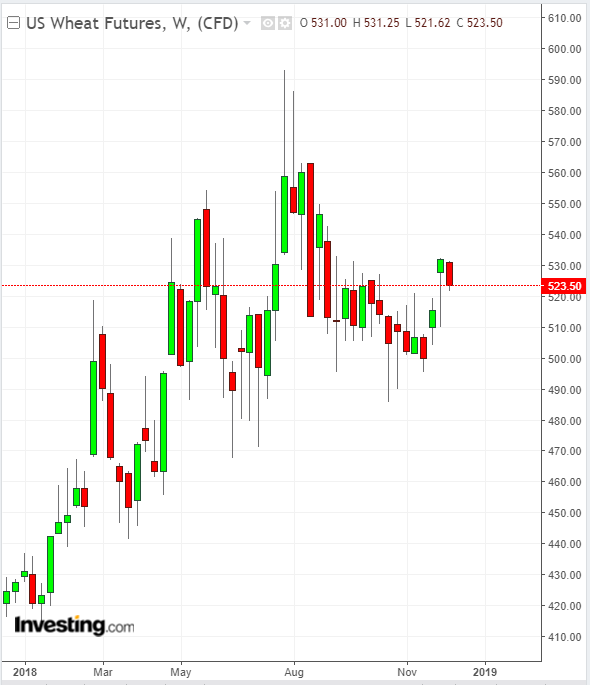
At Monday’s settlement of around $5.25 per bushel, wheat futures for March delivery in Chicago was up more than 22 percent on the year, making it the best performing commodity after natural gas, which showed a gain of 53 percent (desktop users, click here and go to “performance” to see all commodity returns).

Technical analysts polled by Investing.com rated wheat a “Strong Buy” from a daily perspective, with no indicators it was overbought despite its relatively high gain on the year. Strongest Level 3 resistance for wheat from a classic chart outlook was at nearly $5.36 per bushel—meaning the March contract had an upside of another 11 cents per bushel or so.
The strong outlook did not mean wheat was immune from the daily price swings affecting other commodities, said Mike Seery of Seery Futures, who pointed to Monday’s broad slide in oil, metals and grains prices caused by trade war concerns as one example. Said Seery:
“Wheat prices are trading above their 20-day moving average but still below the 100-day MA, which stands at $5.42 per bushel."
Bullish Trends Looking Likely In 2019
Added Seery:
“The next major level of resistance is around 5.40 / 5.45 as we are now entering the very volatile winter season for wheat prices as Australia's crop has been reduced due to a significant drought as today's price action was basically blamed on profit taking. I do think as we enter 2019 the bullish trends will arrive once again.”
Shawn Hackett of Hackett Financial Advisors, an agricultural markets consultancy in Boca Raton, Florida, concurred:
"We remain fundamentally bullish the wheat market and believe that reduced Russian exports starting in December against a very cold Northern Hemisphere winter should offer a series of winter kill events and produce bouts of upside price volatility.”
Hackett added that recent smart money buying into a flat wheat market was a bullish sign that had triggered what he described as a “Short-term Smart Money Oscillator” buy signal, although there was more buying required to trigger a “Long-term Smart Money” buy signal.
In Doubt Over Wheat? Look At Corn
Welch said one clear indicator for wheat was corn as prices for the two agricultural commodities tended to move in the same direction despite differing fundamentals. He said corn prices typically had their seasonal highs in April through June, and as the harvest in corn approached, wheat growers could get an idea of what their own price prospects could be.
“If we were to see a situation of strongly higher or lower corn prices, I think that would have a strong influence on wheat, particularly at harvest in 2019,” said Welch.
Just Go Out And Plant
Such an outlook would not just work for the Southern Plains, where wheat “just fits,” but in the rest of the country as well, noted Welch. To enumerate wheat’s problem, production in Texas, the second smallest state for the grain, dwindled to around 68 million bushels last year versus 90 million in 2015. In top growing state Kansas, it fell to 334 million from 467 million, he said.
“So, you get your yield above average and get a decent price, that’s not a bad picture for wheat. I think that’s a pretty good outlook for us. It’s the best outlook we’ve had in several years when it comes to the wheat market.”
