- All Instrument Types
- Indices
- Equities
- ETFs
- Funds
- Commodities
- Currencies
- Crypto
- Bonds
- Certificates
Please try another search

RBNZ Cuts Rates: NZD/USD Rallies And Gold Bubble

RBNZ Cuts Rates:
As expected, the Reserve Bank of New Zealand cut interest rates by 0.25% from Wellington this morning. I know that I’ve used the Auckland skyline as my cover photo for today’s blog, but how good does it look! …I apologise to any readers from Wellington that I may have upset.
The market was, however, looking for a much more dovish tone from Wheeler, but with the jawboning toned down and the now standard line of:
“Some further easing seems likely.”
The kiwi dollar actually rallied quite hard across the board after the cut.
With NZD/USD having come off as much as it has over the last few months, the RBNZ was happy to remove the phrase:
“The level of the New Zealand dollar is unjustified.”
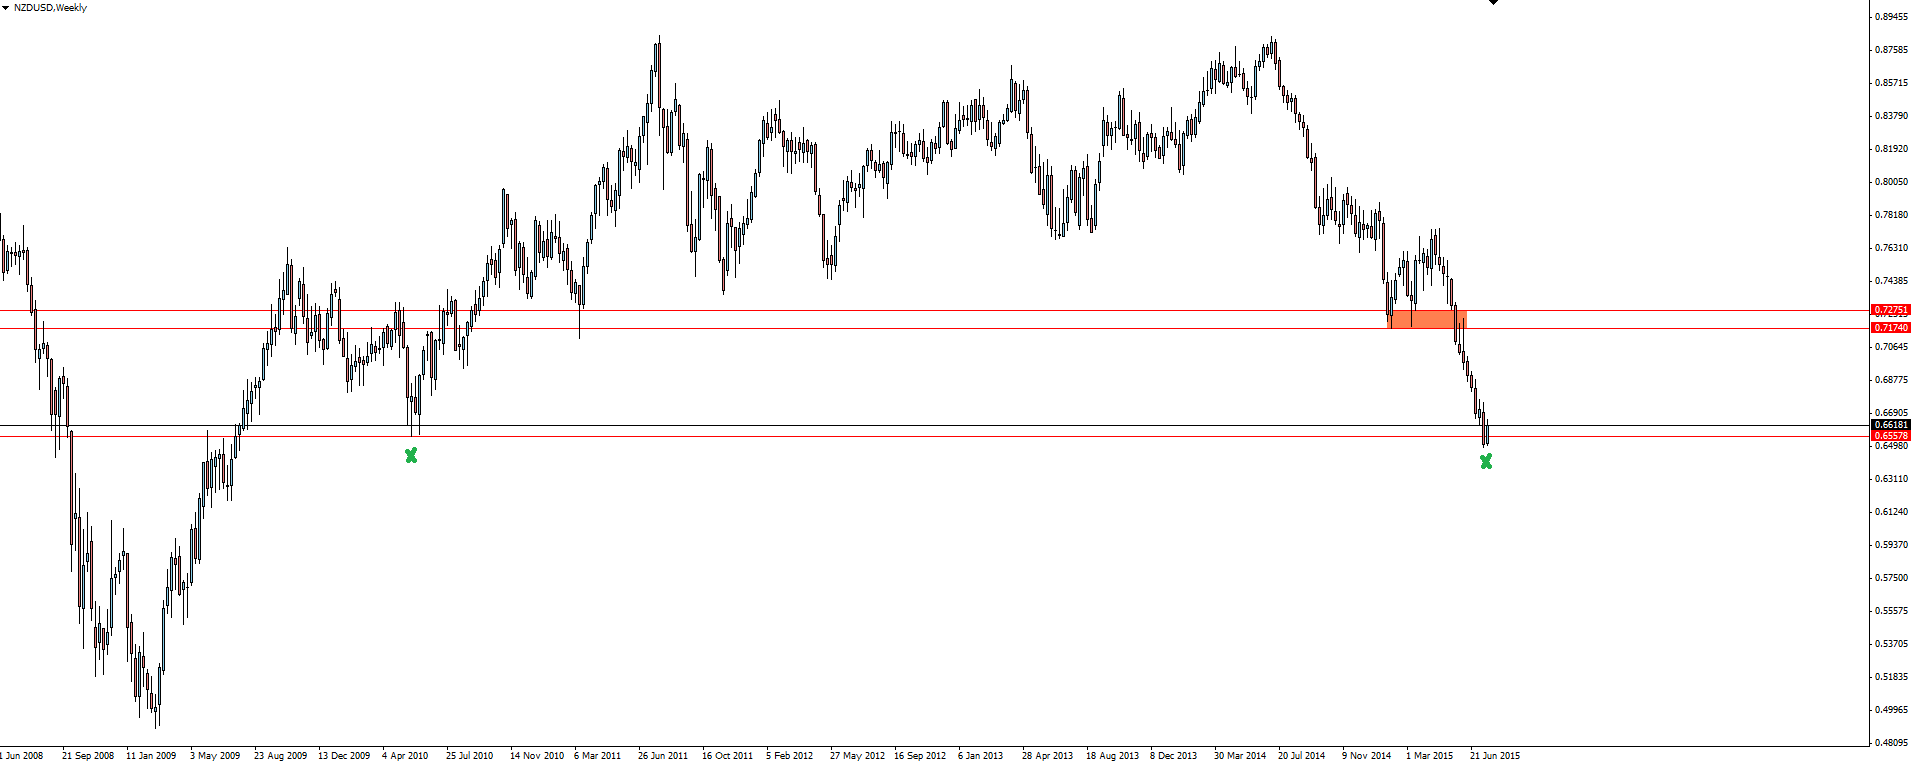
NZD/USD Weekly
Click on chart to see a larger view.
Just how much the kiwi has come off its highs is highlighted by the above weekly NZD/USD chart. The drop between the previous 2 support/resistance levels has been basically vertical!
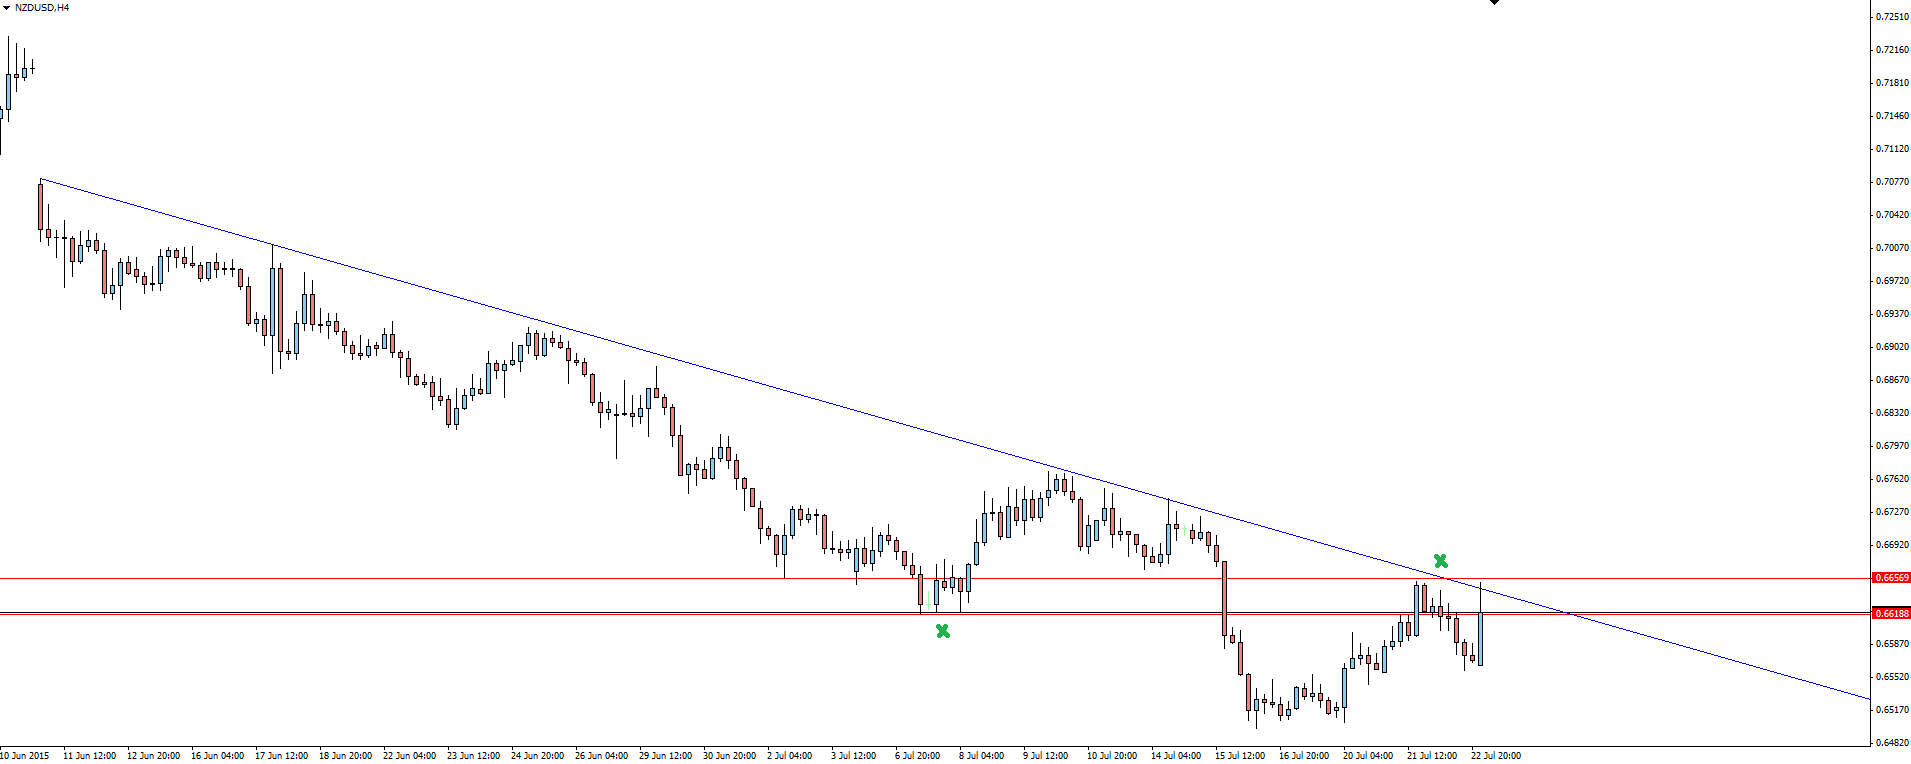
NZD/USD 4 Hourly
Click on chart to see a larger view.
Zooming into the 4 hourly chart, you can see that price has also been capped by a short term bearish trend line. Following the rate decision, price spiked back into trend line resistance, which also lines up with previously broken support now being respected as resistance.
An interesting place to possibly join the short train?
The Gold Bubble:
Gold today is looking at its TENTH straight day of declines. If it gets there, this would be the longest losing streak that the precious metal has seen since 1996!
Goldman Sachs' (NYSE:GS) head of commodities gave us this pearler of a prediction in the WSJ today:
“Gold prices will drop below $1000 a troy ounce for the first time in more than 6 years.”
We all know the reputation of Goldman’s public ‘predictions,’ but it’s interesting to look at a chart on the back of this.
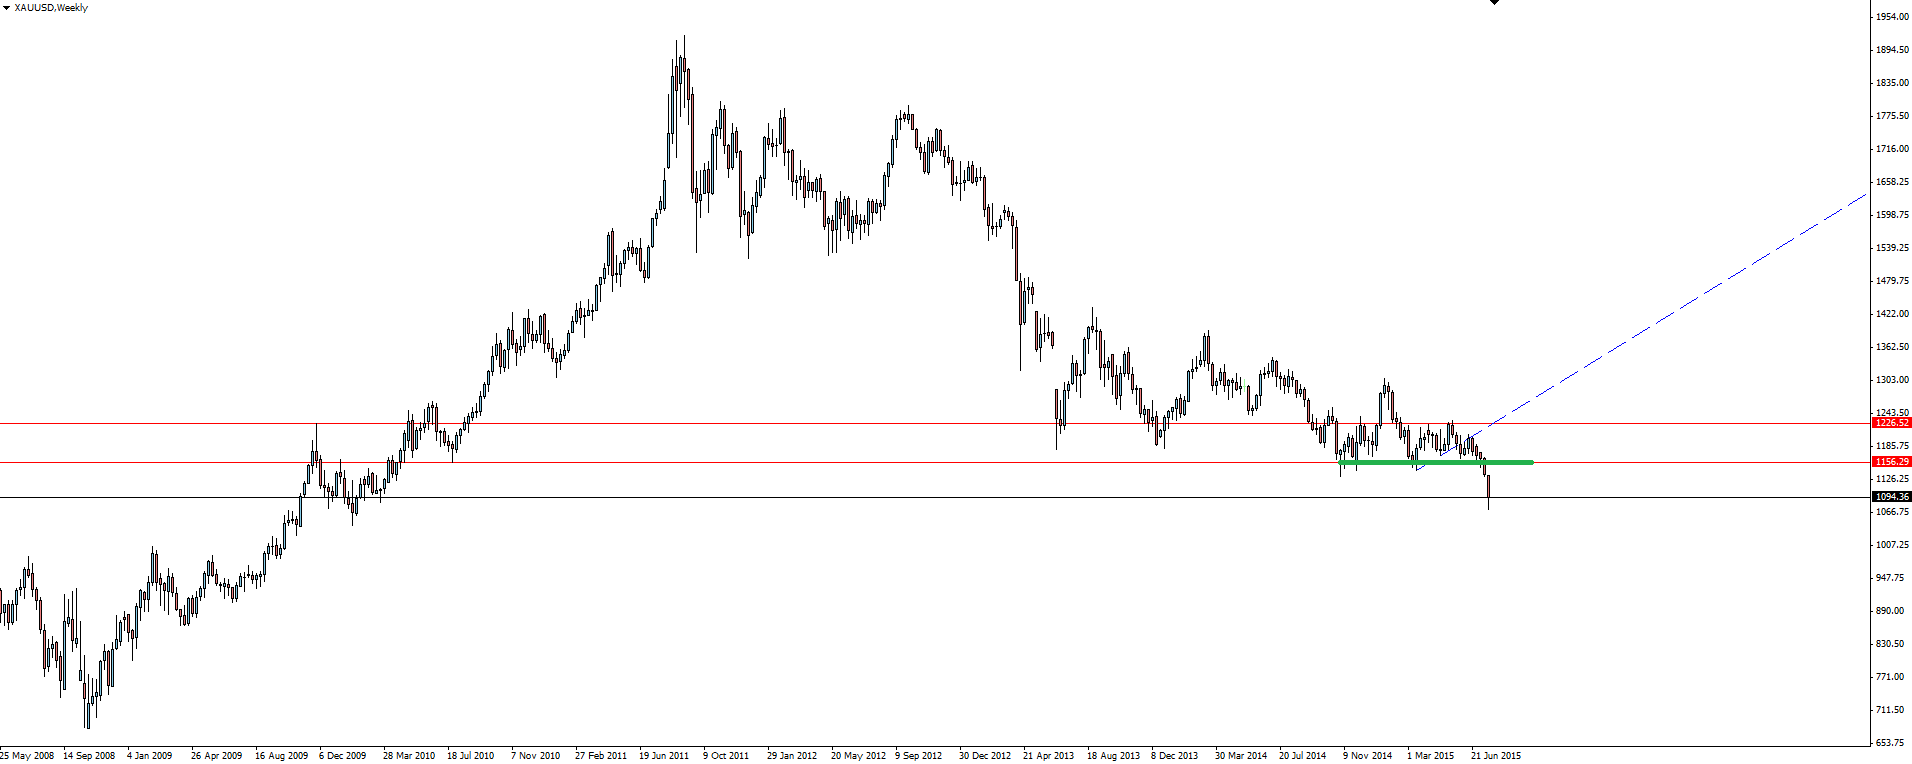
Gold Weekly
Click on chart to see a larger view.
We talked about it earlier in the week but that break of weekly support really is hugely significant. Following the ultimate doom and gloom scenario that a break up of the Eurozone could have posed, the price of gold, the supposed safe-haven asset, STILL fell. If gold can’t find any strength in that market environment, what hope does it have once the Fed actually starts raising rates?
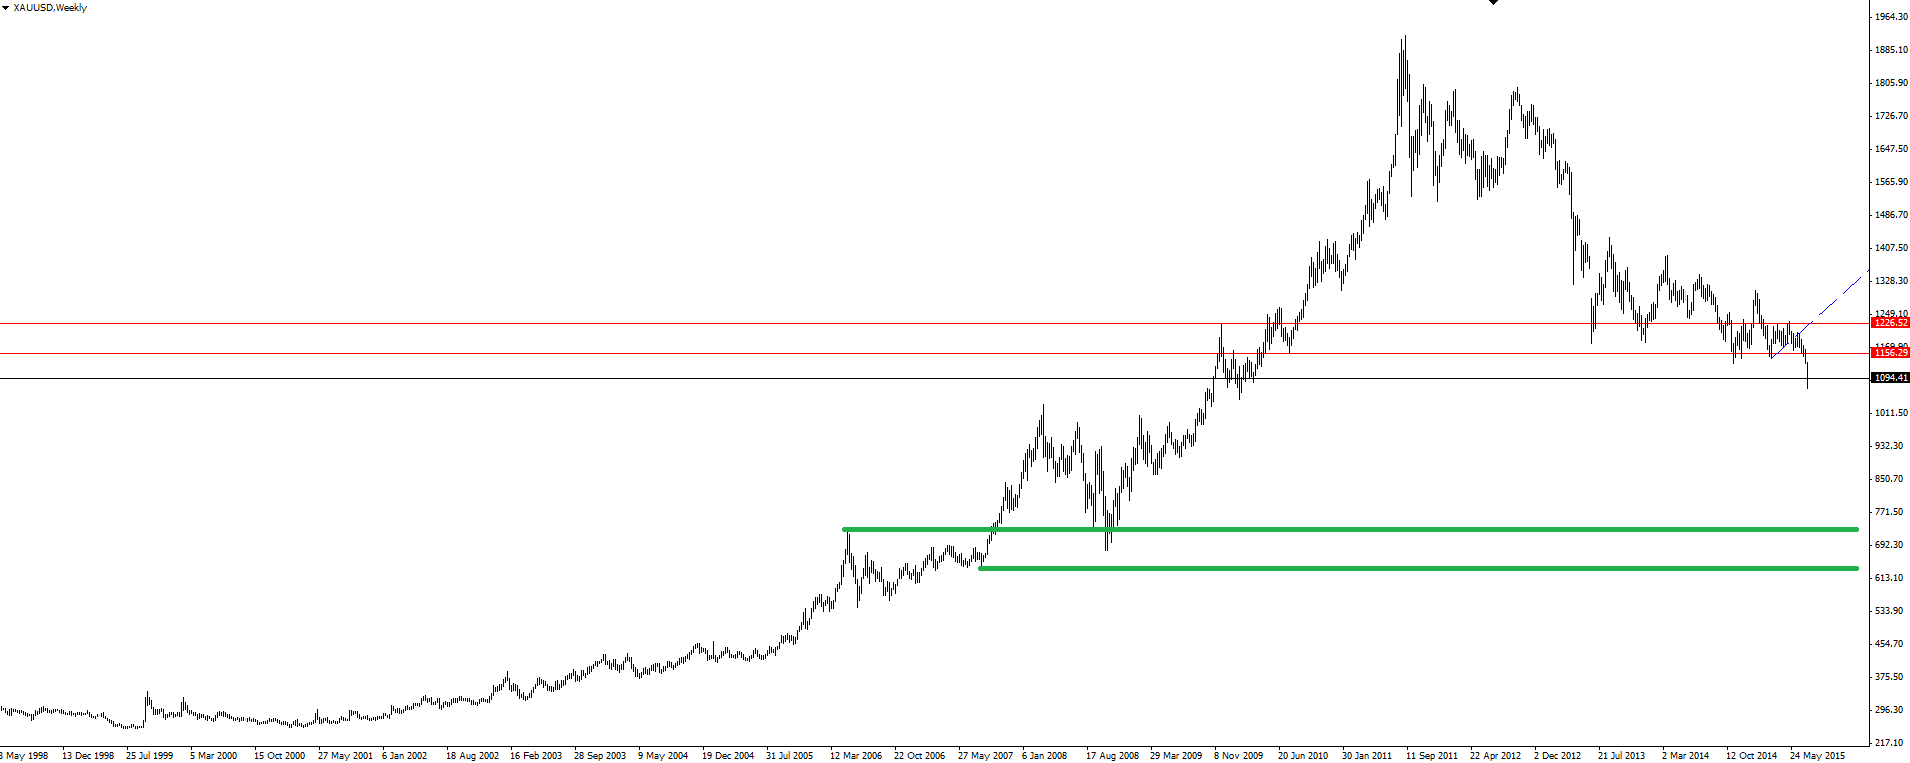
Gold Weekly 2
Click on chart to see a larger view.
Now zoom out again and look at what could be considered a fair value once you come close to being back in the early 2000s trading range. You’re still looking at the possibility of huge falls to come, even lower than what Goldman are saying.
My opinion is that when the loudest gold perma-bulls and fiat currency doomsday predictors have all been shaken out and public sentiment finally turns bearish, then the bottom will be in. Interestingly enough, Friday’s CFTO sentiment data actually turned bearish.
Do you see that as significant?
———-
On the Calendar Thursday:
NZD Official Cash Rate (3.00% v 3.00% expected)
NZD RBNZ Rate Statement (Less dovish than expected)
JPY Trade Balance
AUD NAB Quarterly Business Confidence
EUR Greek Gov Debt Crisis Vote
GBP Retail Sales
CAD Core Retail Sales
USD Unemployment Claims
———-
Related Articles

Recent headlines appear to have shaken investor sentiment. It’s premature to read too much into a few days of weaker-than-expected survey numbers. More importantly, the latest...

The stock market sold off on a decline in February's Consumer Confidence Index (CCI), confirming a similar decline in February's Consumer Sentiment Index (CSI), which was reported...

The EU’s most costly budgets, bitcoin’s market swings, and rising US bankruptcies. Each week, the Syz investment team takes you through the last seven days in seven charts. 1. The...
Are you sure you want to block %USER_NAME%?
By doing so, you and %USER_NAME% will not be able to see any of each other's Investing.com's posts.
%USER_NAME% was successfully added to your Block List
Since you’ve just unblocked this person, you must wait 48 hours before renewing the block.
I feel that this comment is:
Thank You!
Your report has been sent to our moderators for review


Add a Comment
We encourage you to use comments to engage with users, share your perspective and ask questions of authors and each other. However, in order to maintain the high level of discourse we’ve all come to value and expect, please keep the following criteria in mind:
Perpetrators of spam or abuse will be deleted from the site and prohibited from future registration at Investing.com’s discretion.