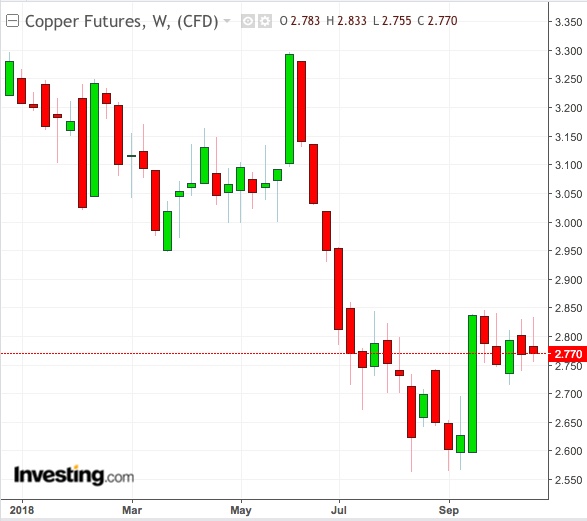
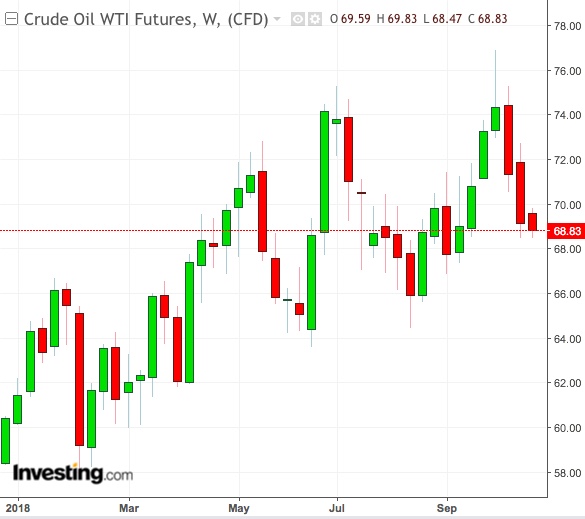
Logically, as the world’s leading industrial commodities, the stars of oil and copper should rise and fall together. Yet their prices have been following separate trajectories this year, with US crude advancing 15 percent and the red metal declining by just as much. Perhaps more ironically, they have had the same key performance driver: US President Donald Trump.

Aside from developed and emerging market idiosyncrasies, the US president’s policies have been responsible for much of the divergence in the oil and copper markets this year. For oil bulls, Trump gave the gift of Iranian sanctions. For copper bears, he began a trade war with China, slapping hefty tariffs on the world’s largest consumer of the metal and various other commodities.
Historically, the net speculative position in oil and copper held by hedge fund managers and other commodity investors has broadly moved in tandem, suggesting a “complementary” effect of one on the other.

In the past two years though, this correlation has broadly turned negative, with the most stark example being the past summer, when copper hit one-year lows while US crude traded near four-year highs.
Fund Managers Substituting Metals With Energy?
This has prompted the question of whether higher investments in oil were crowding out investments in metals as fund managers “substitute” the latter with energy in their portfolio.
Goldman Sachs, investigating this phenomenon in a note on Monday, cited a number of factors, starting from different stages of Developed Market (DM) and Emerging Market (EM) cycles to market structural changes and US government actions.
Oil was basically a DM-centric commodity and demand was high, making up for its lack of uptake in EM countries, while copper suffered from a lack of tight supplies in the EM environment, the Wall Street bank said. It added:
“Relatedly, policies implemented by President Trump this year have also played an important role in driving the disconnect between oil and copper. For example, (China) tariffs have negatively affected metal prices while supply declines on the back of the upcoming Iran sanctions have boosted oil prices.”
But oil’s star has also faded over the past month as the “fear factor” related to the sanctions on Iran, which begin on November 4, subsided amid talk of another possible oil glut in the making from Saudi Arabia. The West’s energy watchdog IEA and oil producers’ group OPEC have both indicated comfortable and growing supplies for oil lately. Oil services firm Baker Hughes said last week that the U.S. oil rig count was at 3-1/2 year highs, indicating more drilling activity. The US EIA is, meanwhile, on track to report a fifth straight weekly build in US crude.
All these have pulled West Texas Intermediate, the benchmark for US crude, down from a November 2014 high of $76.89 per barrel to Monday’s settlement of $69.17, slashing its previous year-to-date gain of 28 percent to 15 percent. Investing.com’s daily technical outlook has a “Strong Sell” recommendation on WTI, with Level 3 Fibonacci support – the strongest low point – pegged at $67.94 – indicating potential for it to lose another $1.25 or 1.8 percent.
Copper Could Rebound
In copper’s case, however, the recommendation is a “Buy”, with Level 3 Fibonacci resistance—the strongest high point—set at $2.855 per lb versus Monday’s settlement of $2.786. While the market is down 15% on the year, the outlook means it could cut that loss by 2.5%.
Even if WTI doesn’t fall further, copper could reduce its divergence with oil by rebounding by year end, according to a Fitch Solutions analysis on Chinese metals demand.
Thirty percent of China’s copper consumption resides in its real estate sector, which is due for a second-half pickup from reduced corporate and personal taxes, the credit and macro intelligence arm of Fitch Ratings said in note issued on Friday. The agency added:
“Additionally, in the autos sector, the output of new energy vehicles, which contain 2-3 times as much copper as normal combustion engines, including hybrid and battery-powered units, has been strong in the year-to-date compared to overall vehicle production. and this trend will continue.”
