- Nvidia stock made new all-time highs yesterday, hitting an intraday high of more than $540 per share.
- Potential and current investors are wondering if the stock can continue to rally beyond these levels.
- As the stock hovers near critical resistance at an average of $495, a weekly close above this level could reignite the rally, potentially targeting $730 and even $1000.
- Looking to beat the market in 2024? Let our AI-powered ProPicks do the leg work for you, and never miss another bull market again. Learn More »
Nvidia (NASDAQ:NVDA) recorded an impressive 239% increase in 2023, pulling a good share of the S&P 500's 24% gain. But for those who thought the stock couldn't rally further, 2024 also started on the right foot for the AI giant.
In fact, the Santa Clara, California-based giant has so far posted an impressive 8.46% performance since the new year, hitting a new all-time high yesterday, even as the S&P 500 moved sideways.
The crucial question now is whether Nvidia can sustain its upward momentum throughout 2024 or if the rally has already gone too far.
One of the main secrets behind Nvidia's stellar performance last year was its financial results, which consistently surpassed expectations as the company actively dominated the rapidly evolving field of artificial intelligence, swiftly establishing itself as the market leader with its chip production powering AI applications.
As a matter of fact, Nvidia's Q3 earnings showcased a sales increase of over 200%, reaching $18.1 billion compared to the previous year.
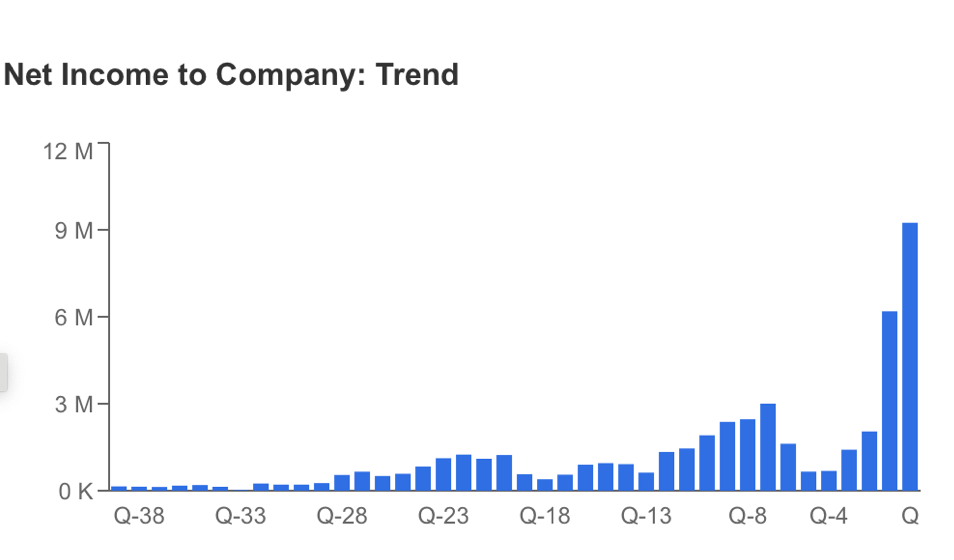
Consequently, the company's net profit experienced a remarkable surge, soaring from $700k in the same period the previous year to an impressive $9.2 billion, as per the latest quarterly results. See below:
Source: InvestingPro
Can the Chipmaker Continue to Post Staggering Gains?
While the company is focused on the field of artificial intelligence, and considering that this sector is still in its early stages, it can be said that Nvidia, the market leader, has more room for growth.
Moreover, the company started 2024 with strong financials, and expectations for the last quarter's results are high. 
Source: InvestingPro
In addition to its leading position in the semiconductor industry, Nvidia has a high score in profitability, cash flow, and growth items.
The company also remains an attractive stock for long-term investors with its regular dividend payments. All these strong fundamentals provide strong evidence that the rally could continue in 2024 while maintaining price momentum.
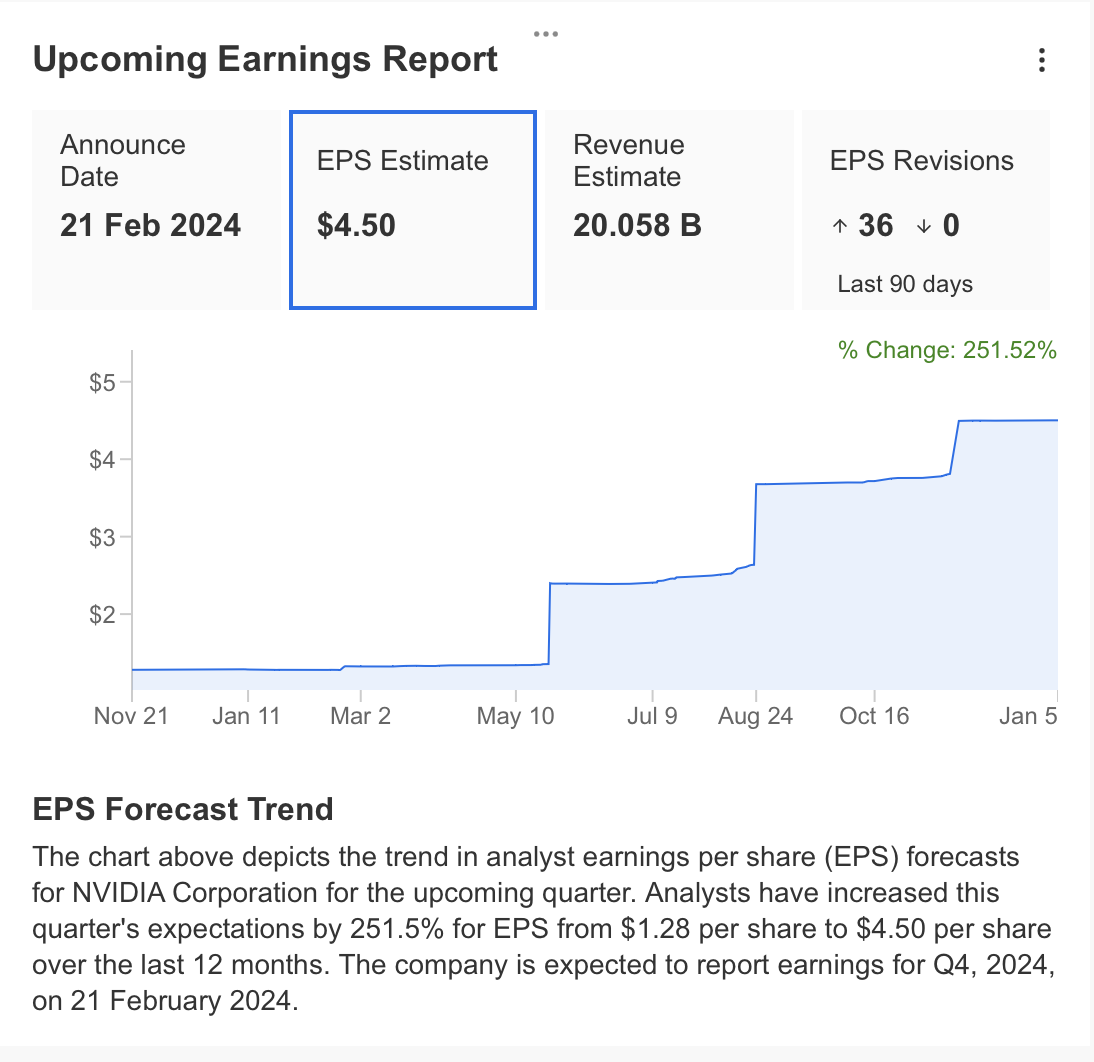
If we take a look at the expectations for the last quarter of 2023, profit per share is projected at $4.5 in the financial earnings report expected to be announced on February 21.
The quarterly revenue forecast is $20 billion. Nvidia has outperformed expectations throughout 2023 and if it continues to do so in Q4, this will be an additional catalyst for momentum in the share price.

Source: InvestingPro
If we check the 2024 quarterly expectations on InvestingPro; the company's EPS is estimated to rise 60% year-on-year to close to $20 and revenue is estimated to increase 54% to $90 billion by next year.
Although these estimates are lower than the leap in 2024, they can be revised according to the company's performance throughout the year.
Source: InvestingPro
If we look at the price performance of the share in 2023 in general; we can see that a significant part of the rise came in the first half of the year.
The share price rose by only 16% in the second half of 2023, showing that it is more in a consolidation phase.
This gives the stock a low Price/Earnings ratio relative to the price, which remains lower as the stock's financials continue to rise, making it still look cheap.
Technical View
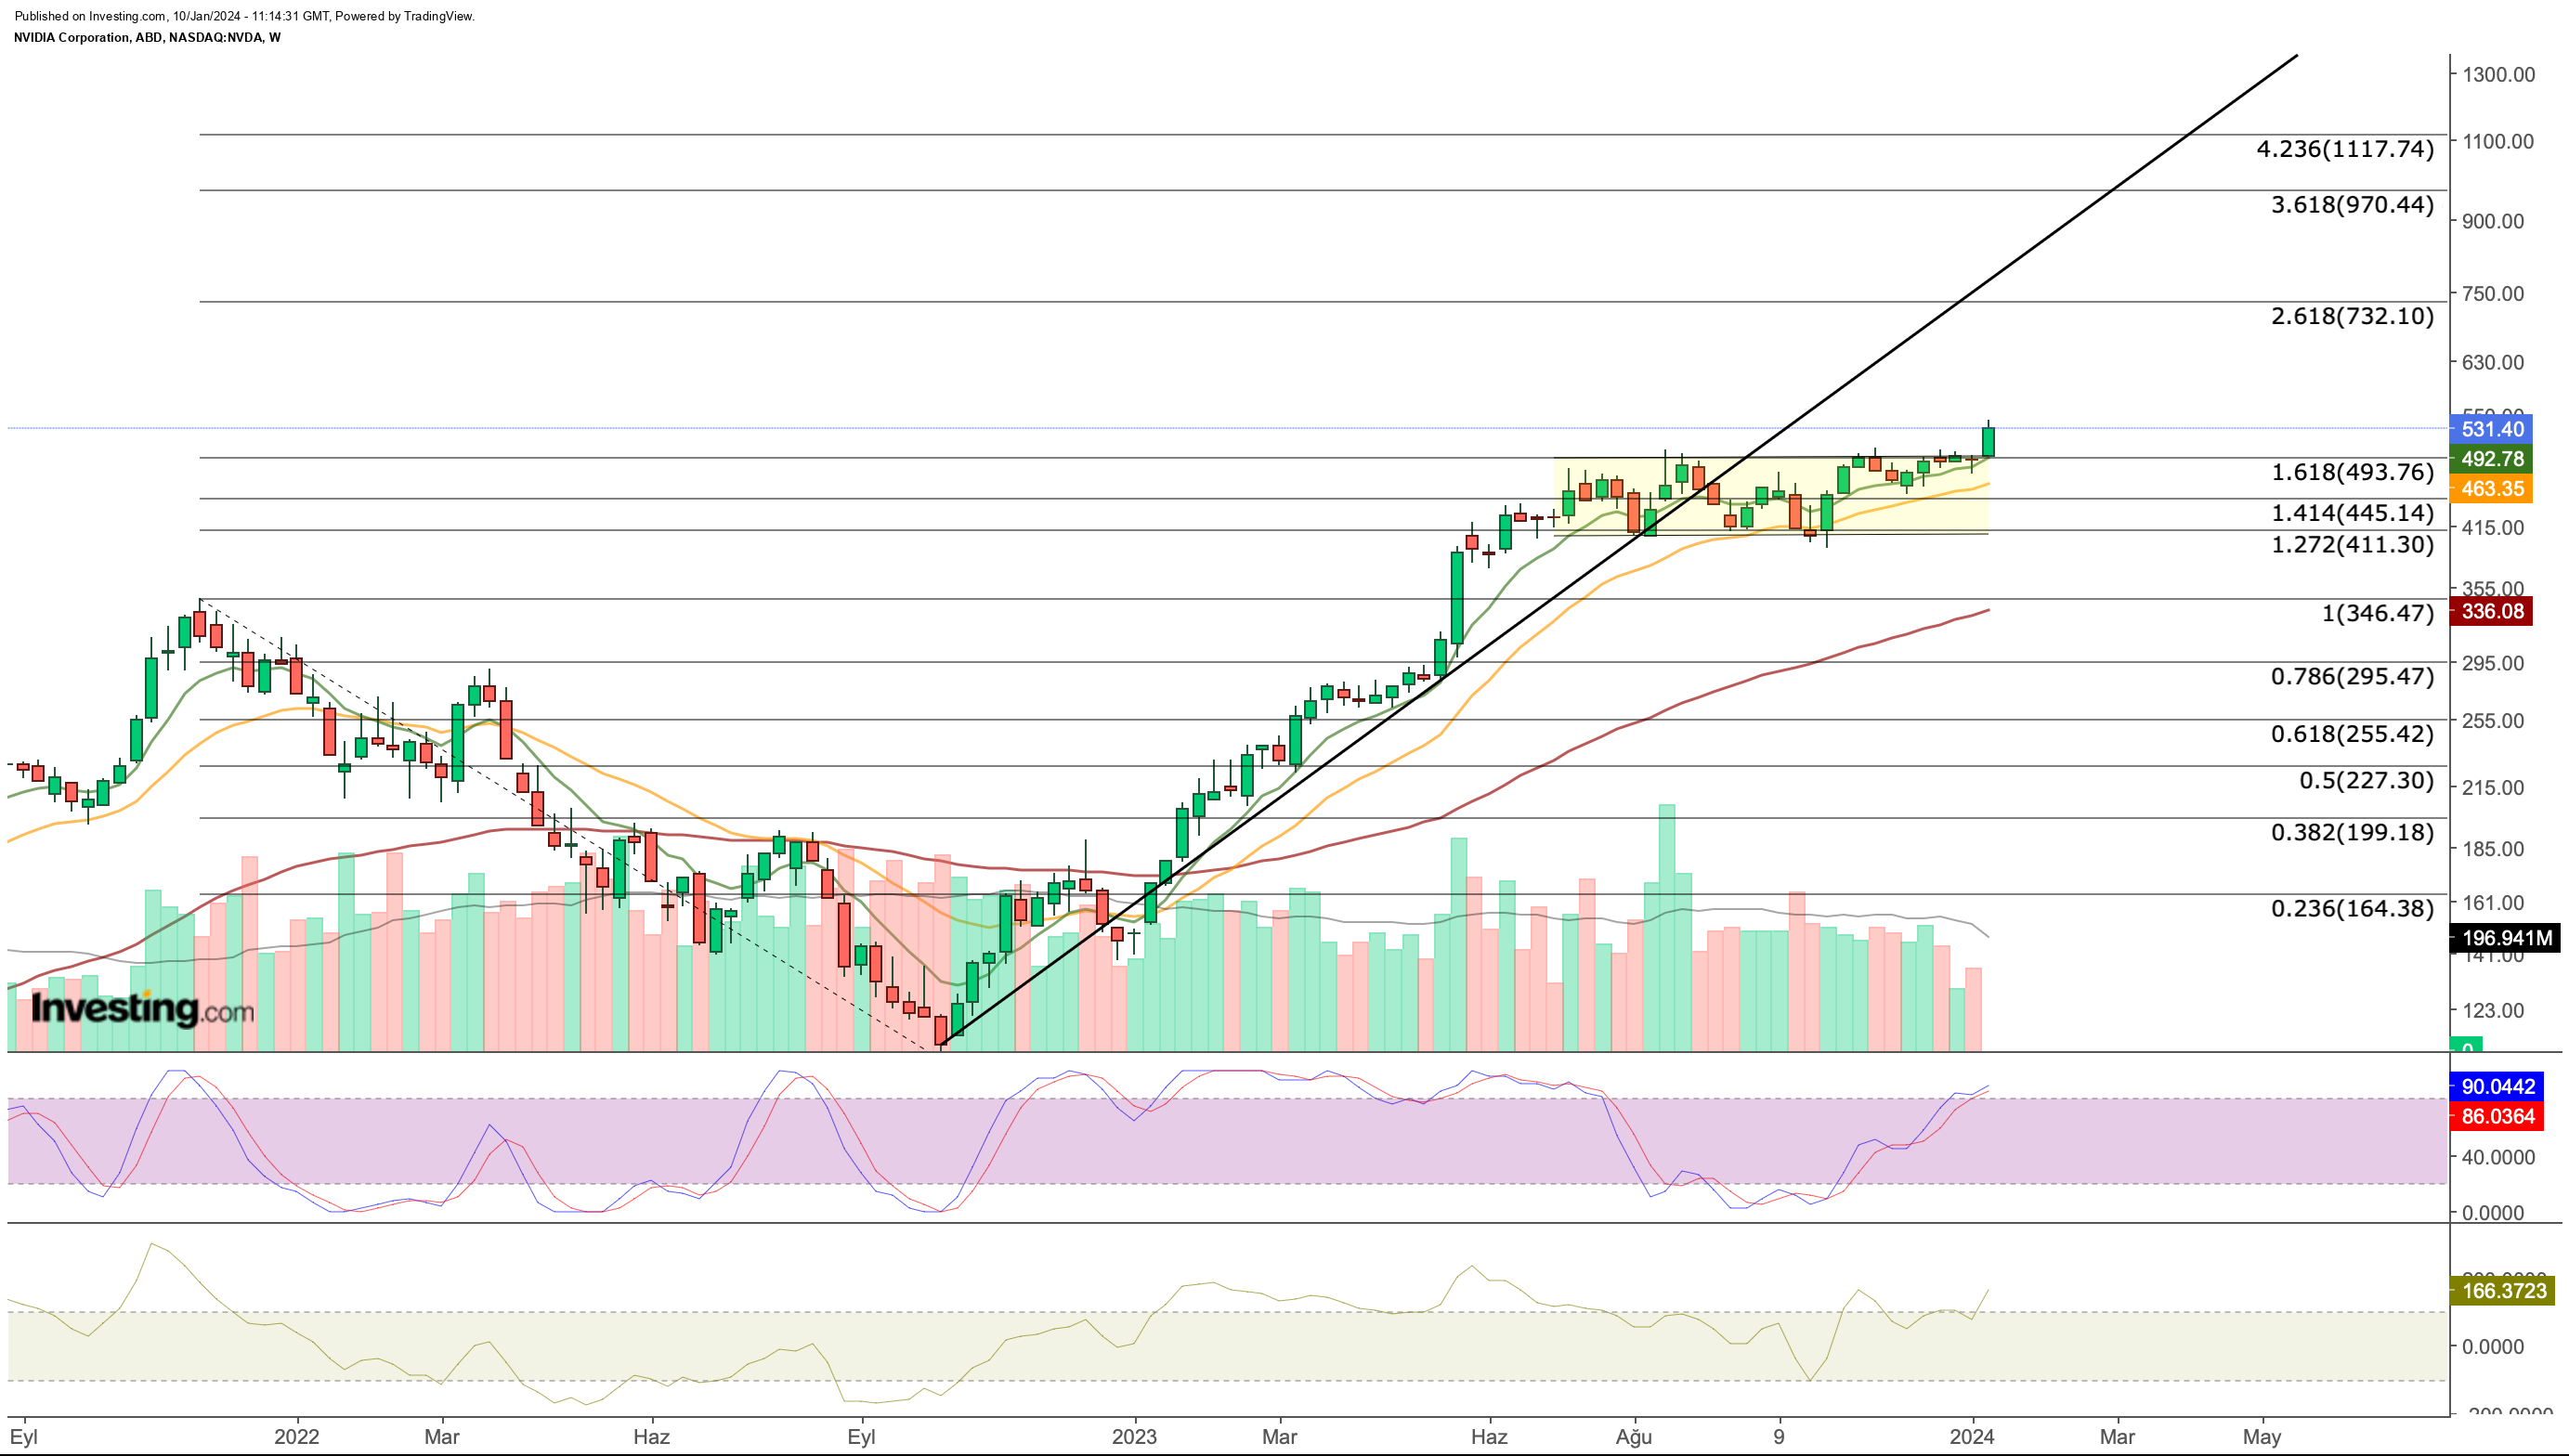
From a technical perspective, we can see that the NVDA rally has slowed at Fibonacci expansion levels relative to the previous year's downtrend. The Fib 1,272 - Fib 1,618 range formed the support and resistance zones for the share price.
While the first week of 2024 was quiet, a move above the critical resistance at an average of $ 495 came as the stock started to be in demand again this week.
If there is a clear weekly close above this price level, it can be seen that the rally may start again.
This shows that the next price target could be $ 730, again based on Fibonacci levels. After this target, another move towards $ 1000 may become likely.
In addition, the Stochastic RSI cooled down on the weekly chart in a relatively flat course since July.
The Stoch RSI, which turned up as of October, is now about to reach the overbought zone, just like at the beginning of last year.
If we pay attention to last year's outlook, the indicator, which remained flat at the overbought level throughout the year, supported the rise. In the early days of 2024, a similar situation is in place.
However, a correction should not be ruled out. Therefore, the average of $490 can be followed as the first support for NVDA.
Below this price, there is intermediate support at $ 450 at a weekly close, while $ 410 remains an important support price for the second and correction not to deepen.
***
In 2024, let hard decisions become easy with our AI-powered stock-picking tool.
Have you ever found yourself faced with the question: which stock should I buy next?
Luckily, this feeling is long gone for ProPicks users. Using state-of-the-art AI technology, ProPicks provides six market-beating stock-picking strategies, including the flagship "Tech Titans," which outperformed the market by 670% over the last decade.
Disclaimer: The author does not own any of these shares. This content, which is prepared for purely educational purposes, cannot be considered as investment advice.

