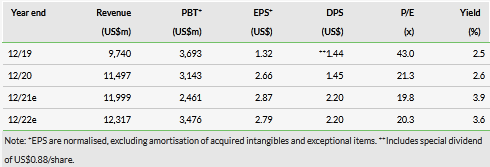
Newmont's (NYSE:NEM) Q321 results were closely in line with our prior forecasts (see Exhibits 1 and 2), albeit with relative outperformance from its Australian operations largely offsetting underperformance from its North American ones, where output continued to be adversely affected by lingering coronavirus disruptions. In conjunction with its Q3 results, Newmont updated its guidance for FY21 to gold production of 6.0Moz (cf 6.2–6.8Moz previously) at a cost applicable to sales of US$790/oz (cf US$750/oz previously). However, this was always likely after its announcement of 5 October outlining some of the challenges faced in commissioning the autonomous haulage system at Boddington, including severe weather and heavy rainfall. Nevertheless, performance in Q421 is still expected to show a material improvement over the first three quarters of the year, as the rains abate in Western Australia and Africa, and North America returns to a more normal operating environment. As a result, adjustments to our forecasts for Q421 and FY21 in the wake of Q3 results have been negligible (see Exhibit 4).

Longer-term cost pressures already anticipated
Echoing comments made elsewhere in the industry, Newmont confirmed that it was experiencing inflationary pressure on costs, in particular in the areas of materials, energy and labour. Once again, this was largely prefigured at the time of the company’s Q221 results on 22 July. Newmont will update the market regarding its long-term production and cost guidance in December. In the meantime, however, Edison’s longer-term financial forecasts are based on cost assumptions for the period FY22–25 that are now at a premium of anything between 1.2% and 22.7% relative to Newmont’s last formal long-term guidance dating to 8 December 2020 (see Exhibit 6).
Valuation: 23.4% premium to the share price
In the light of these changes, we have reduced our valuation of Newmont by a modest 2.2% to US$70.05/share (cf US$71.61/share previously), albeit this reduction, to some extent, reflects a (perhaps surprising) recent decline in inflation expectations (as measured by US 30-year breakeven inflation rate; source: Bloomberg, 10 November 2021) in conjunction with a general de-rating of the senior gold mining sector generally since 26 October. This valuation puts Newmont on a premium rating relative to its peers. However, this may be justified by the company’s size, track record and the fact that almost all of its operations are in top-tier jurisdictions. It remains cheap relative to historical valuation measures, which (on average) continue to imply a share price in excess of US$90/share.
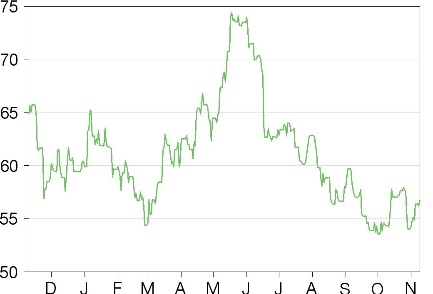
Share price performance

Business description
Founded in 1916, Newmont Corporation is the world’s leading gold company with a world-class portfolio of assets in North and South America, Australia and Africa. It is the only gold producer in the S&P 500 Index, and is widely recognised for its ESG practices and as a leader in value creation, safety and mine execution.
Click on the PDF below to read the full report:
