The weather models dictating natural gas traders’ books are driving them crazy — and the reason is quite simple: few can really understand what’s happening to the weather now.
It’s mid-January, a time of the year when heating demand indoors should be peaking. Yet, here we are, with average chill across most of the United States, particularly the Northeastern region, which happens to be the country’s largest gas-driven heating market.
“Natural gas is coming under more pressure as old man winter seems to have taken the last train to the East Coast,” said Phil Flynn, senior market analyst for energy at Chicago brokerage Price Futures Group.
Just How Warm Is It?
Flynn recites data from Bret Walts at forecaster BAMWX, who writes that major changes have occurred on the Ensemble Prediction System (EPS), the closely-watched European model for medium-range weather.
According to Walts, the EPS has lost more than 30 heating degree days (HDDs) since Tuesday. HDDs measure the number of degrees a day's average temperature is below 65 Fahrenheit (18 Celsius). They are used to estimate demand to heat homes and businesses.
Walts reports that the Global Ensemble Forecast System (GEFS), another widely-followed model, has seen warmer trends too of late, though not to the extreme of the major EPS trends. The GEFS is a weather forecast model made up of 21 separate forecasts. Prior to its recent warming, the GEFS had averaged more than 30 HDDs too cold for the second week of January.
“Model chaos has been high as of late,” Flynn wrote. Further, Walts said in a BAMWX report that strong global winds favored warmer risks in the Eastern United States, setting the region up for lower-than-normal heating demand in the second week of February — a period that should typically be colder than January.
No ‘Sustained’ Cold
“As of now, we do not see a ‘sustained’ cold pattern in the Eastern U.S.,” said Walts. “Into late January and February, we are losing our major source of cold air as the Polar Vortex returns to the other side of the planet.”
He adds: “Any cold looks to remain rather transient.”
Dominick Chirichella of the Energy Management Institute concurs with that view.
“A system will bring wintry impacts across parts of the North Central/Northeast U.S. Friday through the weekend,” Chirichella said.
“Cold will be at least occasionally introduced into the pattern past day 4 (of the week), although interludes of warmth are still possible.”
The bearish views on natural gas come as the market once again awaits storage numbers due at 10:30 AM ET (15:30 GMT) from the U.S. Energy Information Administration (EIA), which will be reporting for the week ended Jan.10.
Draw Forecast: Bullish On Week, Bearish On 5-Year
Analysts are expecting the EIA to cite a storage draw of 95 billion cubic feet (bcf) for the just-ended week. On the surface, that’s bullish, considering that it’s more than double the 44 bcf draw during the previous week to Jan. 3. Yet the 95 bcf is about half the size of the drawdowns averaged over the past five years for the same week.
Add the unyielding record highs in U.S. gas production week after week — and the maddening, mercurial weather — and there’s little reason to feel bullish, say those in the trade.
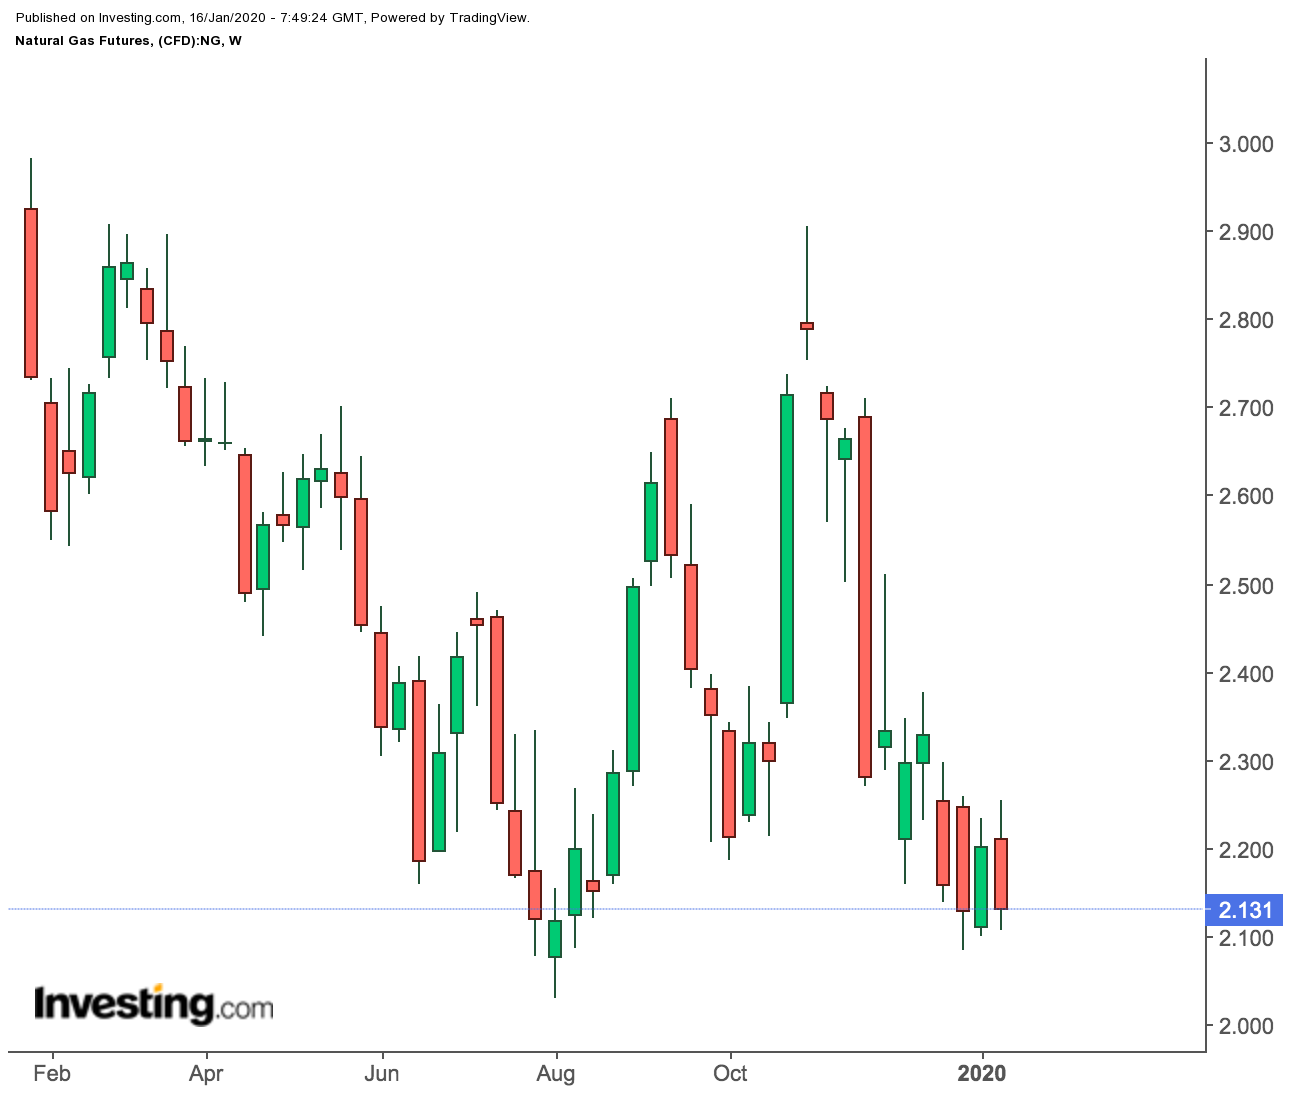
That explains the price action behind the February front-month gas contract on the New York Mercantile Exchange’s Henry Hub, which came within a dime of breaking the key $2 per million metric British thermal units (mmBtu) support last week. 
In Wednesday’s trade, February gas settled down 3.1% at $2.12 per mmBtu. Since the start of 2020, it has fallen 2.7%, after losses of 13.4% in November and 4% in December on the front-month contracts of the Henry Hub.
“Weather models have curtailed forecasts for cold weather after an initial blast early next week and have been the primary driver behind the market’s pullback,” said Dan Myers, analyst at Houston-based Gelber & Associates, who, like Walts and Flynn, also blames it on the vanishing HDDs.
No Break From Production This Year
If that’s not bad enough, U.S. gas production is expected to remain at record highs throughout this year, sliding only in 2021, the EIA said in its Short-Term Energy Outlook for January, issued Tuesday.
The agency forecasts dry natural production to average 94.7 bcf per day in 2020, up almost 3% from the 2019 average of 92 bcf per day. Accordingly, with the higher production, the EIA expects Henry Hub prices to average $2.33 per mmBtu this year, down 9% from the 2019 average of $2.57.
But as “relatively low natural gas prices contribute to a reduction in natural gas-directed drilling,” production is expected to taper to 94.1 bcf per day next year, representing the first annual decline since 2016, said the EIA.
