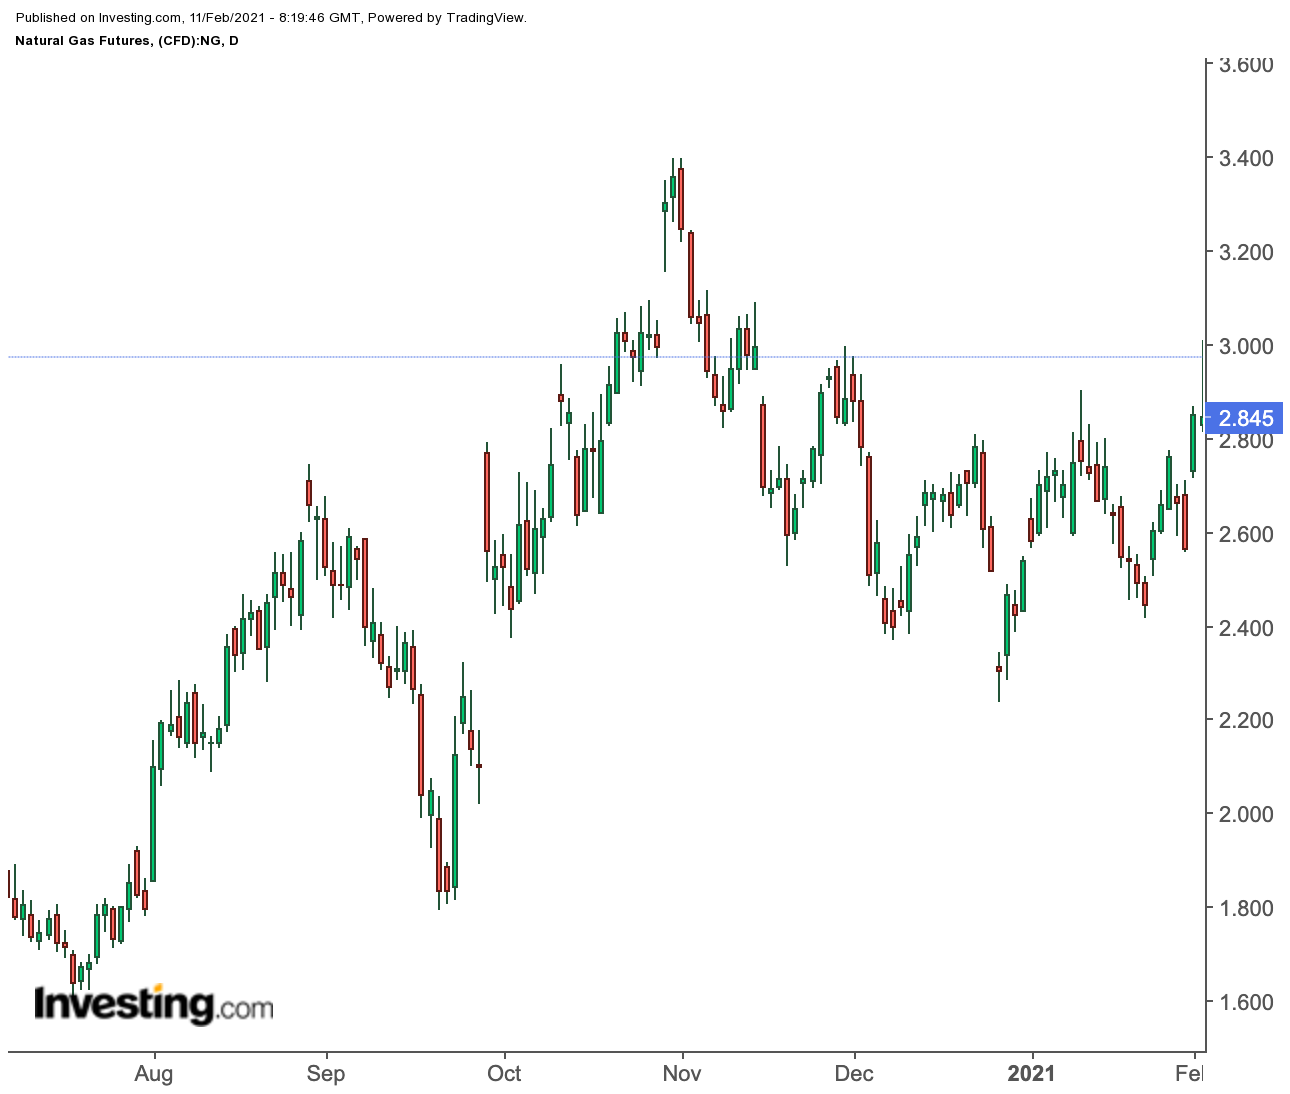
Volatile weather forecasts are keeping natural gas traders on the edge as predicting storage draws for heating gets trickier by the week.
Little about this winter has been normal, from the slow arrival of freezing temperatures to their rapid drop in a matter of weeks.
Typically, in a season like this, chills from late December turn progressively colder in January and February. This time, however, the United States experienced one of the warmest Christmases ever and real cold did not start until about three weeks ago.

Complicating the outlook for gas traders are the European and American weather models. They have been at odds about when and where extreme cold would break next, after the spate of snow storms that hit the US Northeastern coast since last week.
More Extreme Cold Likely
Houston-based gas market risk consultancy Gelber & Associates explained this in an email to Investing.com on Wednesday:
“What both the models agree on is that the extreme cold is going to be somewhat more extreme.”
“As weather forecasts continue to remain volatile, Mother Nature is moving the needle on gas prices, with the market see-sawing from $2.74/MMBtu to $3.00/MMBtu over the past week.”
Naturalgasintel.com, an industry portal, made a similar observation on the weather model and gas price swings in recent days:
“Weather model fluctuations are nothing new, but when it’s the dead of winter and a polar vortex has plunged into the Lower 48, gas traders take notice. So it’s no surprise that March futures trading has been erratic in recent days.”
In Thursday’s early trade in Asia, front-month March gas on the New York Mercantile Exchange’s Henry Hub moved as high as $2.99 per mmBtu, or per million metric British thermal units. Last week, March gas breached the key $3 per mmBtu mark the first time since January 2019.
Another Significant Gas Draw Expected
The relatively-strong performance was in anticipation of the U.S. government reporting later in the day for another significant storage draw number for gas-fired heating.
Industry analysts tracked by Investing.com expect the US Energy Information Administration to report at 10:30 AM ET (15:30 GMT) on Thursday a storage draw of 181 bcf, or billion cubic feet, for the week ended Feb. 5.
While that projection falls short of the 192 bcf drawn down during the prior week to Jan. 29, it would still be higher than the 121 bcf used up during the same week a year ago and the five-year (2016-2020) average consumption of 125 bcf for the period.
If the analysts are on target with their 181 bcf projection, the decrease would take total gas stockpiles down to 2.508 tcf, or trillion cubic feet. That level of inventory would still be 6% higher than the five-year average but about 1% below the same week a year ago.
As for weather impact, data from Refinitiv showed that there were 188 HDDs, or heating degree days, last week, compared with a 30-year normal of 193 HDDs for the period.
HDDs, used to estimate demand to heat homes and businesses, measure the number of degrees a day's average temperature is below 65 degrees Fahrenheit (18 degrees Celsius).
Gelber, commenting on the weather impact expected in the near-term, said:
“The primary factor now is that the peak cold has been lifted once again beyond the 1-10 day range, however it expected to be even cooler than before.”
Gelber said it had made significant changes to its gas storage predictions due to anticipation of more extreme cold.
“We anticipated last week’s withdrawal to be 175 bcf, slightly lower than previously expected. However, as weather models push cold outward, we anticipate an even larger, 290 bcf withdrawal for the week ending Feb. 19. This represents a staggering 100% increase in the size of the withdrawal in comparison to the same time last year.”
LNG Demand Has Slowed
Naturalgasintel.com said a move above $3 for gas may have to wait due to lower export demand for LNG, or liquefied natural gas, which saw less shipments after heavy fog clouded the Gulf Coast much of this week, prompting many key ports and waterways to impose shipping restrictions.
LNG demand has steadily fallen since the start of the week, reaching 10.3 bcf by Wednesday, off from 11.3 bcf on Monday.
As of last Friday, the amount of gas flowing to US LNG export plants averaged 10.7 bcf per day so far in February, up from January's 10.4 bcfd average and on track to tie December's 10.7 bcfd record high.
Gas Daily Technical Outlook Remains At 'Strong Buy'
On the pricing front, Investing.com’s Daily Technical Outlook on Henry Hub’s front-month remained at a “Strong Buy.”
Should the contract extend its bullish trend, as it’s expected to, a three-tier Fibonacci resistance is forecast, first at $2.97, then $3.03 and later at $3.12.
In the unlikely event the market reverses, then a three-stage Fibonacci support is expected to form, first at $2.79, then $2.73 and later at $2.64. In any case, the pivot point between the two is $2.88.
As with all technical projections, we urge you to follow the calls but temper them with fundamentals—and moderation—whenever possible.
Disclaimer: Barani Krishnan uses a range of views outside his own to bring diversity to his analysis of any market. As an analyst for Investing.com he presents divergent views and market variables.
Comments are welcome and encouraged. Inappropriate comments will be reported and removed.
