Hurricanes are destructive. But they can also be a boon to energy producers when they boost flagging oil and gas prices.
Hurricane Zeta, which lashed the Louisiana Coast on Wednesday during a storm season to remember, might leave a third impact: a further battering of the liquefied natural gas market.

U.S. LNG exports are already tottering this year due to the coronavirus pandemic and this Category 2 storm isn’t going to make things easier.
Dan Myers, analyst at the Houston-based gas risk consultancy Gelber & Associates, noted that even in the run up to the arrival of Zeta, almost 1.21 billion metric cubic feet of daily gas output—or some 45% of all production in the U.S. Gulf Coast of Mexico—was shuttered.
LNG Pain After Zeta?
But there could be additional pain for the industry when it reopens after Zeta, he said:
“This has affected overall production and peeled LNG demand away from recent 6-month highs, as cargo loadings hit pause until the storm passes.”
Zeta is the fifth storm to make landfall in Louisiana this year after Cristobal in June, Laura in September and Marco and Delta in October.
It is also the 27th named storm in an Atlantic cyclone season so busy that forecasters have exhausted the alphabet of names and are now working their way through Greek letters. (After Zeta comes Eta, Iota and Kappa.)
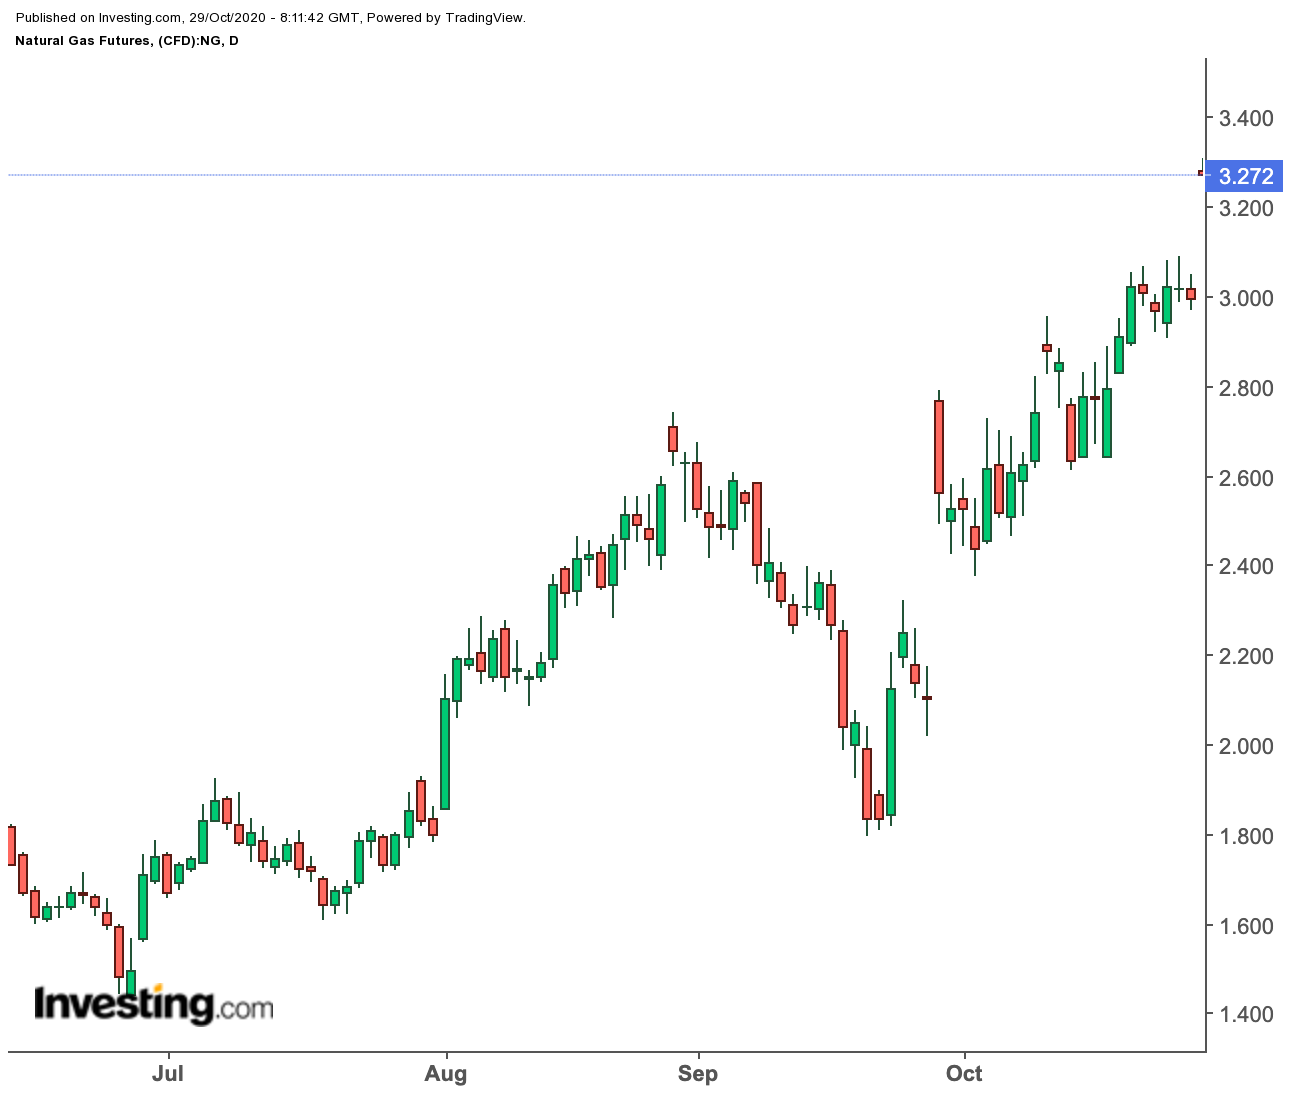
December gas on Henry Hub dipped 0.8%, or 2.3 cents, to settle at $2.99 per million metric British thermal units. But it rebounded ahead of Thursday’s official session in New York, hitting $3.338, its highest level since January 2019.
Despite concerns about the impact of Zeta on LNG, there is an alternative view on how gas prices could perform after the storm.
Mid-November Cold Might Help U.S. LNG
Naturalgasintel.com said that while export disruptions could create immediate downside pressure for gas prices, a colder mid-November may also spark a rally, especially if LNG exports had recovered to full capacity by then.
The industry portal said changes in LNG demand typically had an outsize influence on the direction of the new front-month gas contract on New York’s Henry Hub, with December futures taking that spot on Wednesday.
Citing research by EBW Analytics, naturalgasintel.com said the jury was still out on how LNG exports might perform post-Zeta:
“Until there was more clarity on the weather front, prices are likely to remain volatile. If the pattern holds and LNG demand rises, gains may lie in store for the December contract.”
Data shows that the amount of gas flowing to U.S. LNG export plants averaged 7.4 bcfd so far in October.
That would be the most in a month since April and puts exports on track to rise for the third month in a row, for the first time since February when feedgas hit a record 8.7 bcfd as rising global gas prices prompted buyers to purchase more U.S. gas.
Zeta made landfall in Louisiana a night before the weekly rollout of the U.S. Energy Information Administration’s gas storage report at 10:30 AM ET (1430 GMT) on Thursday.
For the week ending Oct. 23, analysts expect the EIA to report a smaller-than-normal 37 billion cubic feet of injection into storage due to a rise in LNG exports—even though heating demand was lower than usual.
The build for the week ended Oct. 23 compares with an increase of 89 bcf during the same week a year ago and a five-year (2015-2019) average build of 67 bcf for the period.
Utilities injected 49 bcf of gas into storage in the prior week ended Oct. 16.
Last Seasonal Storage Build For U.S. Gas?
Most analysts said this will likely be the last injection of the year.
But if they are on target, the increase during the week ended Oct. 23 would boost stockpiles to 3.963 trillion cubic feet. That would be 8.1% higher than the five-year average and about 8% above the same week a year ago.
The weather was warmer than normal last week with only 51 heating degree days, or HDDs, compared with a 30-year average of 65 HDDs for the period. HDDs, used to estimate demand to heat homes and businesses, measure the number of degrees a day's average temperature is below 65 degrees Fahrenheit, or 18 degrees Celsius.
Colder winds from the central U.S. are forecast to spread to the rest of the eastern half of the nation early next week and bring a couple of days of temperatures much below-to-well below normal.
Dominick Chiricella, director of risk and trading at the Energy Management Institute in New York, wrote in his Wednesday market advisory, citing the Global Forecast System, or GFS, weather model:
“In the 11-15 day period, the new GFS intensifies the unseasonable warmth in the central and eastern U.S. even further to reach well above to far above normal for a few days, while it drops a significantly colder air mass into the West with widespread well below normal temperatures.”
“Though the GFS remains an outlier because of its extremity, other model guidance has begun to trend colder in the western and central U.S. for the 11-15. As a result, the new 11-15 has been trended in this direction but not to the extent that the GFS indicates.”
Disclaimer: Barani Krishnan does not have a position in the commodities or securities he writes about.
