Natural Gas On A Plateau. Here's What To Watch

Published 06/09/2020, 08:20 pm
Updated 09/07/2023, 08:32 pm
DX
-
NG
-

Natural Gas Futures on the Nymex faced a mixed week before closing 2.80% lower than a week ago at $2.57. EIA confirmed on Thursday a build of 35 Bcf in working underground stocks for the week ended August 28.

Stocks currently 18.4% higher y/y. 13.4% above the 5-year average. Both percentages coming down fast during this injection season although the average rate into storage has remained 7% above the 5-year average. This is one of a few basic factors that made us remain bullish since May. That is when we started buying the dips again, just after the post-winter downtrend and a floor at $1.50 that had been formed in the middle of the coronavirus crisis.

A breakout in an uptrend on seasonality looked very probable then and that is the case. The U.S. oil and gas industry's consolidation is ongoing. Supply and demand will have to be re-examined at the start of the withdrawal season in November. End of year hedging is crucial for this market but we are not there yet.

We have been trading directionally, already taking 20% two times since May in real-time trading, and here is where the analysis gets tougher. Are we on a plateau on our way to $3.00? January contract currently at $3.39 can confirm this. May is at $2.80 and there are too many papers out there calling $4.00 for winter 2022 already.

Let's be cautious and let the trading volumes guiding us. We want to buy any exhaustion on momentum and see where this uptrend goes and how much higher. This is the precious thing about trading directionally on near term charts. You don't have to overanalyze. U.S. housing data really positive lately, the commodity will be well supported in a weaker dollar environment. Let's be careful though with the latest Daily MACD bearish crossing as Fall contracts tend to exhaust on lower demand just before another winter spike. U.S. macro data and the Dollar Index to be routinely monitored. Daily, 4hour, 15min MACD and RSI pointing entry areas.
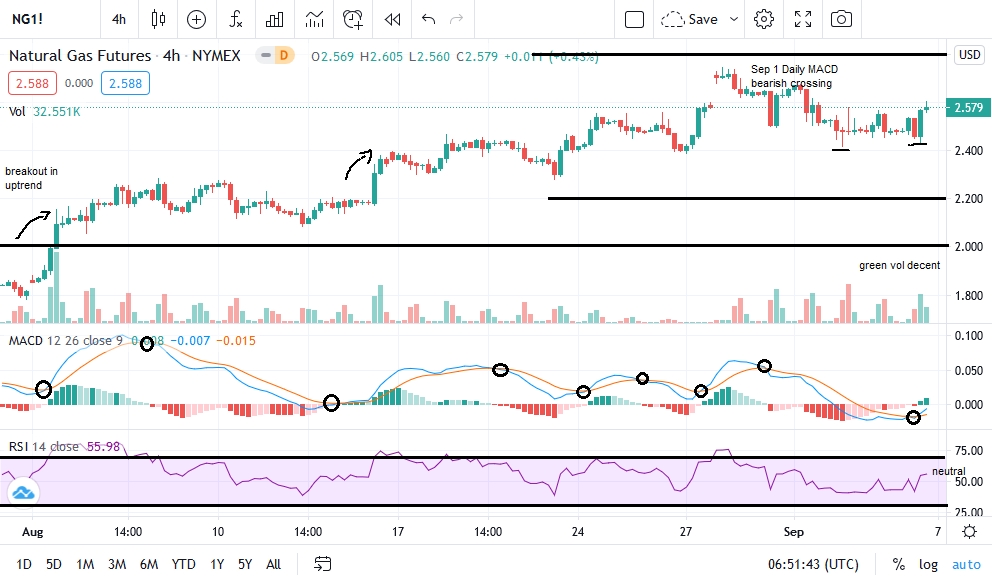
natgas_chart_9.7.20

Latest comments

Loading next article…
Risk Disclosure: Trading in financial instruments and/or cryptocurrencies involves high risks including the risk of losing some, or all, of your investment amount, and may not be suitable for all investors. Prices of cryptocurrencies are extremely volatile and may be affected by external factors such as financial, regulatory or political events. Trading on margin increases the financial risks.
Before deciding to trade in financial instrument or cryptocurrencies you should be fully informed of the risks and costs associated with trading the financial markets, carefully consider your investment objectives, level of experience, and risk appetite, and seek professional advice where needed.
Fusion Media would like to remind you that the data contained in this website is not necessarily real-time nor accurate. The data and prices on the website are not necessarily provided by any market or exchange, but may be provided by market makers, and so prices may not be accurate and may differ from the actual price at any given market, meaning prices are indicative and not appropriate for trading purposes. Fusion Media and any provider of the data contained in this website will not accept liability for any loss or damage as a result of your trading, or your reliance on the information contained within this website.
It is prohibited to use, store, reproduce, display, modify, transmit or distribute the data contained in this website without the explicit prior written permission of Fusion Media and/or the data provider. All intellectual property rights are reserved by the providers and/or the exchange providing the data contained in this website.
Fusion Media may be compensated by the advertisers that appear on the website, based on your interaction with the advertisements or advertisers.
© 2007-2025 - Fusion Media Limited. All Rights Reserved.