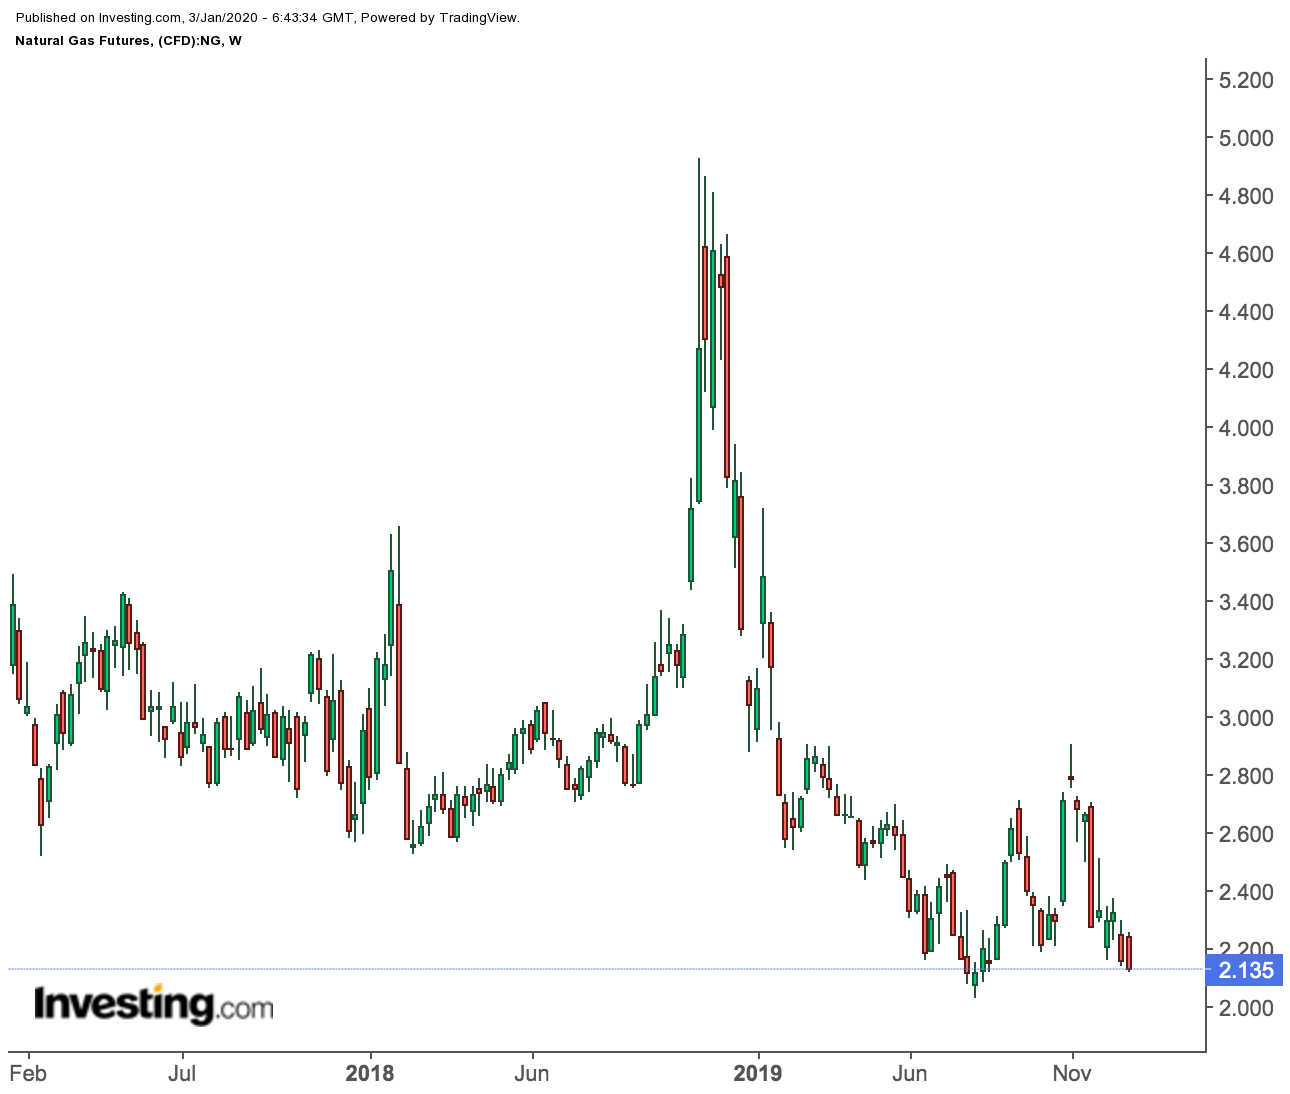
A week ago, I started this column by asking if the natural gas market would be able to clear the $3 pricing bar early into the new year and hold above that level through the full winter schedule.
Now that 2020 is here, let me rephrase that by asking if gas prices will able to withhold $2 support first, before they progress any further. In other words, will the market get worse — i.e. testing the $1 ranges — before it can get better?
There are valid reasons to ask.
In just a week, February, the front-month gas futures contract on the New York Mercantile Exchange’s Henry Hub, has plummeted almost 11 cents, or 5%, to settle Thursday at $2.122 per million metric British thermal units.
Gas Futures At 4-½ Month Bottom
The first trading day of 2020 brought a low of $2.116 per mmBtu to gas futures. That’s a 4-½ month bottom, going back to Aug. 13.
On a cumulative basis, Henry Hub’s front-month lost over 20 cents, or 9%, since the week ended Dec. 15. And March, the next-in-line contract to the front-month, struck a low of $2.088 on Thursday.
The price slump in natural gas is tied to the weather anomalies of last month, where the temperature on some days felt more like early October instead of the freeze typical before the cold season’s most intense months: January and February.
Spot Gas Under $2
In the spot market, gas is already trading below $2, with widespread mild temperatures encouraging further discounts at cash gas hubs across most of the United States. There were double-digit declines in the Rockies and California, according to natgasintel.com, which reported the national average pricing down 14.5 cents on Thursday at $1.915.
A winter that turns out to be less cold than initially thought isn’t new. The last time the United States experienced it was in 2012. The December 2011-February 2012 winter was the fourth warmest on record, with only nine of the 48 contiguous U.S. states experiencing “near-normal cold” in those three months.
Even then, Henry Hub’s front-month only got down to a low of $2.231 in January that winter. We’ve already beaten that low by nearly 12 cents this time.
Investing.com’s Daily Technical Outlook has a “Strong Sell” recommendation for February natural gas, projecting a bottom as low as $2.033 in the near-term.
More Threats From Record Output, Mild Weather
There are, of course, other things that could make it worse for gas bulls. Unyielding record highs in production and more periods of mild weather could result in lower gas burn rates for heating. The combination of these two will result in higher than normal storage of gas that will drive prices even lower.
According to the latest update available from the Energy Information Administration, gas in storage stood at 3.25 trillion cubic feet (tcf) for the week ended Dec 20. That is 525 billion cubic feet (bcf), or 19%, higher than the same week a year ago.
Analysts polled by Investing.com expect the EIA to announce a storage deficit of just 57 bcf for the week ended Dec. 27 in data due at 11:00 AM ET (16:00 GMT) today. That would be markedly lower than the previous week’s 161 bcf draw and the 89 bcf deficit averaged over the past five years.
January Draws Looking “Nothing Too Impressive”
“Draws from storage will rise as January goes on, but (will be) nothing too impressive for the heart of winter,” wrote Dan Myers, analyst at Houston-based gas consultancy Gelber & Associates.
According to natgasintel.com, the midday Global Forecast System (GFS) run added several heating degree days back to the outlook, but remained “little changed” compared to 24 hours prior.
“The latest GFS still forecasts an exceptionally bearish pattern through Jan. 15 besides a brief cold shot” for the northern portions of the United States around the middle of next week, the portal said, citing NatGasWeather data.
“Far From Cold Enough”
While Thursday’s guidance was “far from cold enough” through the first half of the month, the pattern held potential for some cold air from Western Canada to make its way into the United States beyond Jan. 15, NatGasWeather said, adding:
“It will need to be convincing to turn bearish weather sentiment bullish, and it will also require the European model to be on board with a colder pattern if it’s to be believed.”
Maxar’s Weather Desk similarly highlighted warmer trends for days six through 15 of the latest forecast window on Thursday.Further out in the Jan. 12-16 time frame, Maxar also predicted “prevalent” above-normal temperatures over the eastern half of the Lower 48 states.
Volatility Could Be In Store Too
Looking at historical price trends, analysts at EBW Analytics Group observed that for each of the past five years, prices have moved at least 10% between year-end and mid-January.
“In January 2018 and 2019, gas skyrocketed over 20% before receding,” the EBW analysts said. “Should weather forecasts turn colder and spur short-covering, a similar outcome may be in store this year.”
Still, for four of the past five years, the front-month contract fell by the end of January, according to the firm:
“On average, prices posted a 5% increase by mid-January before stumbling to a net 5% decline by the end of the month."
“In 2020, even if prices do briefly surge higher, an oversupplied seasonal outlook appears likely to reverse any short-term gains for natural gas.”
