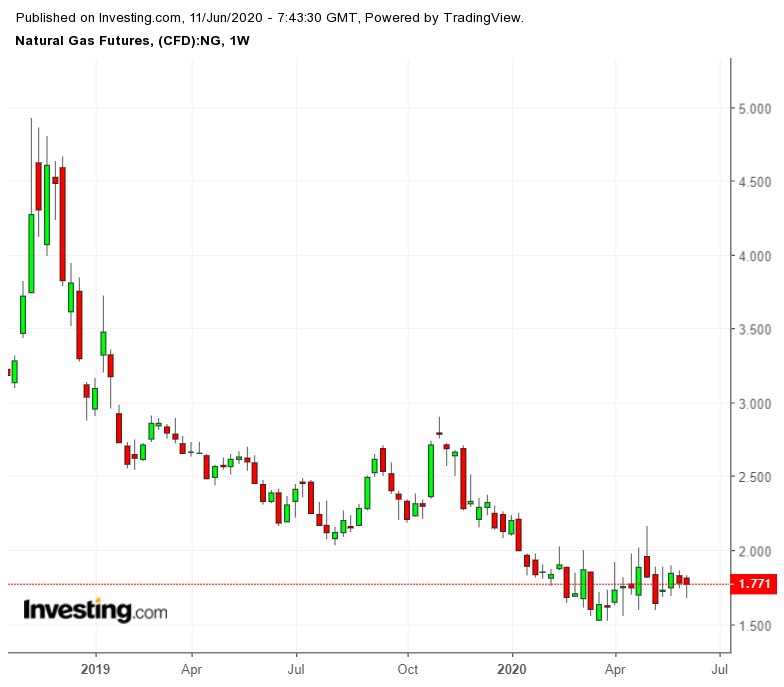
The waiting game for summer heat has begun, and natural gas bulls will get to see how fast the market delivers on their conviction for $2 and above pricing.
The past couple of weeks have been somewhat range-bound, if not volatile, for Henry Hub front-month futures. But that could change in the next couple of weeks, as hotter days and nights force Americans to crank up their air-conditioning, which in turn requires power stations to burn more gas to feed that extra energy demand.

“Low production and robust power burn are beginning to show up in shrinking injection estimates, providing price support," said Dan Myers of Houston-based consultancy Gelber & Associates.
Summer Begins In Earnest
Naturalgasintel.com made a similar call, citing data from energy intelligence firm Genscape, which said power burns in the Lower 48 States have ramped up since late May “as summer begins in earnest.”
According to the firm, burns breached 35 billion cubic feet per day on June 3, and then again on June 9 and 10.
Weekly data from the Energy Information Administration at 10:30 AM ET (14:30 GMT) that is likely to show an injection of 93 bcf into storage for the week ended June 5, according to a consensus of analysts tracked by Investing.com.
If accurate, the build would be nearly 10 bcf lower than the previous week’s injection of 102 bcf into storage.
It would also be lower than the 107-bcf increase in storage during the same week a year ago, but nearly flat when compared to the five-year (2015-2019) average build of 94 bcf for this period.
A 93-bcf growth for the week ended June 5 would boost national natural gas stockpiles to 2.807 trillion cubic feet. That would be 17.6% above the five-year average and about 36.3% above the same week a year ago.
Storage Report Might Decode Supply-Demand Flux
EBW Analytics Group said the weekly storage report “could be important” since it may provide “more insight into how the supply/demand balance is shifting at a time when supply and demand are both in flux.”
Indeed, if the build for the week to June 5 turns out to be lower than expected, it could signal increased industrial demand as factories that were idled during the worst of the pandemic reopen and increase power usage. It could also be noted as higher commercial demand as office buildings from New York to California begin readmitting people to work.
“A warming trend will ensue across most of the US during the week two time frame, warmest in the West,” said Dominick Chirichella, director of risk and trading at the Energy Management Institute in New York.
Chirichella said generally above-normal temperatures should take over most of the US during the day 11-15 period.
“The warmest anomalies should be across the West and across the Northeast," he said.
“Widespread 80s with some 90s are possible from the Midwest to New England. More seasonable conditions are possible across the northern Rockies/northern Plains overall.”
Cooling Degree Days Expected To Spike
Genscape added that although temperatures had fluctuated in some regions this month, cooling degree days (CDDs) were expected to increase up to an average of 3.7 above normal between June 19 and June 22. CDDs, used to estimate demand to cool homes and businesses, measure the number of degrees a day's average temperature is above 65 degrees Fahrenheit (18 degrees Celsius).
Higher CDDs, by extension, should push power burns to above 37 bcf daily for the first time on June 18 and sustain that level on ensuing days, Genscape said.
On the pricing front, the July Henry Hub contract was last down 0.22% at $1.776 per million metric British thermal units, having closed up 0.7%, or 1.3 cents on the day on Wednesday.
Still, the front-month is headed for a 0.6% drop on the week, after a 3.6% slide last week. The decline cancels out a rally of nearly 12% in two previous weeks. Natural gas neared five-month highs in early May and has since dropped by 17%.
Also, based on the Henry Hub futures curve, the earliest shot at $2, and above, comes with the October contract, which will only turn into the market benchmark in three months. But, of course, these things can turn rapidly, especially if power burns turn out to be stronger than forecast.
“Power demand is still well above seasonal averages to offset that and there is no sign of production increases either,” said Scott Shelton, energy futures broker at ICAP in Durham, North Carolina.
* Disclaimer: Barani Krishnan does not own or hold a position in the commodities or securities he writes about.
