It isn’t called the “Wild West of Commodities” for nothing.

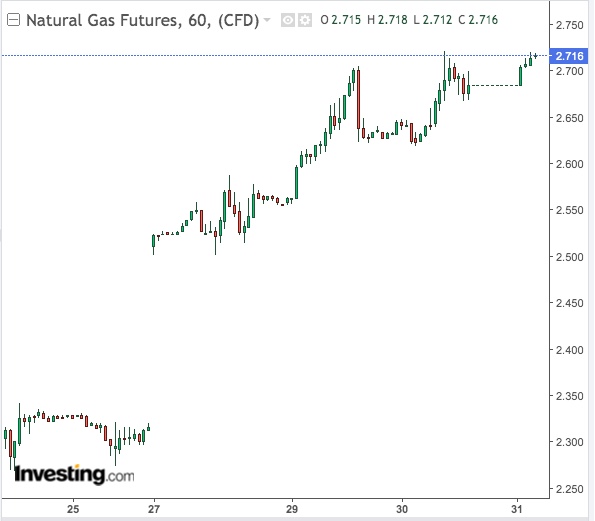
From a weekly decline of just about 1%, U.S. natural gas is suddenly staring at a humongous gain of 17% for the current week.
With another two sessions to go before the end of the week, the gain between the market settlements of Friday and Wednesday is already the highest for a week since January 2014.
It must be noted that this extraordinary rise comes on the back of the weaker November contract being replaced by the pricier December as the market’s front-month in recent days, a change that distorts values somewhat.
But again, December as the current gas benchmark of the New York Mercantile Exchange’s Henry Hub could continue adding to its upward momentum through the end of the week. In that case, the final milestone for the week might be even more spectacular than the present five-year high.
So, what’s the driver for this incredible rally?
The Weather Is Behind It All
As they say in natural gas, it all has to do with the weather—though in this case, it seems to be driven by bets on weather that have yet to arrive.
An abrupt swing in weather forecasts indicating November will be a lot colder than October sent Commodity Trading Advisors, who were bearish on gas, into a covering mode since the trading week ended on Oct. 25. Not only did many of the so-called CTAs get out of their shorts, they’ve also gone long.
Normally, a pole-to-pole shift in market sentiment like that would be accompanied by supportive supply data—meaning stockpiles of gas will be low enough to spark and sustain the rally. But that isn’t the case here.
Six of the past nine weekly injections of gas into storage have been larger than forecast, although analysts think the U.S. Energy Information Administration could report a smaller gas injection number today for the week ended on Oct. 25.
With storage all but excluded as a factor in the rally—unless Thursday’s injection turns out to be a lot larger or smaller than the 86 billion cubic feet build that’s been forecast—the play will be all weather, or whatever the CTAs make out of it.
The Money Trail
Said Scott Shelton, energy futures broker at ICAP in Durham, North Carolina, in a note issued on Wednesday:
“Bottom line in NG now is to ‘follow the money.’ The first few minutes of trading after 9:00 AM EST (13:00 GMT) is generally a good sign of what is to come from the computers.”
He noted that CTA-buying was “solid” through most of Tuesday as the funds continued going from short to long, “buying 250,000 lots as the humans ‘shelter in place' and try to not get in front of the bus.”
Shelton added:
“Usually, when the longer-term systems turn, it continues for a week or so. We are on day 2 or day 3. The question is whether or not the longer-term systems have turned as we are well above the 200-Day Moving Average on the NG continuation, but nowhere near it on the December chart.”
At Wednesday’s settlement, December gas was at $2.691 per million metric British thermal units. For comparison, on Friday the previous front-month on NYMEX’s Henry Hub, November, settled at $2.459. The 200-Day Moving Average is at $2.484.
No Certainty On How Cold It Could Get
So, what’s the weather itself telling?
According to Dan Myers and Dominick Chirichella, two analysts who track natural gas on a daily basis, forecasts indeed tell of a coming freeze. But there’s no consensus on how intense the cold will be or how long it could last.
Said Myers of Houston-based gas risk consultancy Gelber & Associates:
“Weather forecasts for next month have undergone significant cold changes in the Rockies through the East over the last week, mostly based on the deepening cold pattern in the first half of November.”
Myers said private forecaster Maxar expected population-weighted HDDs, or heating degree days, to be higher than both the 10-year and 30-year normal in November as a whole, although still slightly less than last year.
“After the notable, early shot of colder-than-normal temperatures, weather is expected to trend warmer (relative to average) later in the month.”
Chirichella, director of risk and trading at the Energy Management Institute in New York, said snow was expected to continue accumulating from Kansas/Missouri to the Western Great Lakes through Thursday. He said major cold anomalies will impact Central U.S. for the next two weeks, with occasional hits of below-normal temperatures in the East.
Added Chirichella:
“Below normal to well below normal temperatures will be likely across most of the Central and Eastern U.S. for days 11-15. However, there is a bit of model disagreement on how widespread this cold will be.”
“The North-Central U.S. has the best chance and this is where anomalies could become significant once again. The worst case scenario is record-threatening cold. It is unclear how far south and east this cold will get.”
No Telling Either As To How Long The Rally Will Last
So, when do CTAs get out of their longs?
For now, there’s no certainty, said Shelton, adding that the sell signal, when it comes, will be driven by old-fashioned supply—i.e. storage data—versus weather.
Added Shelton:
“The weather, while seeing a solid start, has only been good for about 50 bcf of demand. What happens beyond that is generally witchcraft. Inventories are very high and the shape of the market curve is more backwardated than usual because of what happened last year when stocks were a lot lower than here.”
“I struggle to think that these spreads are worth as much as they are trading, but also struggle to sell them when the CTAs have just begun buying back their shorts.”
