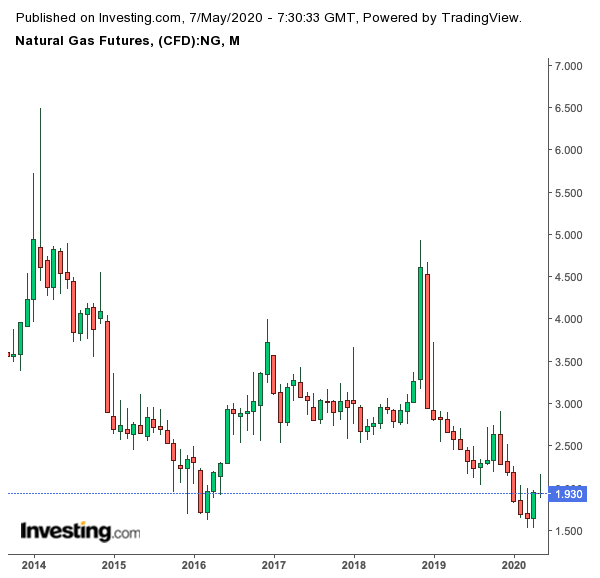
The $2 handle—the all-season minimum for natural gas futures through most of the past decade—continues to be a slippery eel for the market this year.
Even before the advent of the novel coronavirus and the crush in commercial demand for power and heating over the past two months, gas futures could barely get past the $2 per million metric British thermal units (mmBtu) mark due to unyieldingly high U.S. production.

With most of America back at work this week, either partially or fully, Henry Hub’s front-month June gas on the New York Mercantile Exchange gained an impressive 13% in just the first two sessions to reach a near four-month high of $2.162 per mmBtu, before settling at $2.13 Tuesday.
It was the first close above $2 for a front-month gas contract since Jan. 17, helped in part by a power supply squeeze in the Northeast which was caused by an explosion of a 30-inch line on Texas Eastern Transmission’s system in Kentucky late-Monday.
Brief $2 Honeymoon For June Gas
But as with two other explosions on the TETCO system in August and January, gas again was diverted quickly to nearby pipes. With the outage squeeze all but over within 24 hours, and the wow-factor over “Reopen America!” fleeting as the enduring challenges from the pandemic became apparent, June gas was back below $2 by Wednesday’s close.
Except for an aberration between February and March 2016, Henry Hub’s front-month had kept its grip on the $2 handle since 2010. But by mid-February this year, gas bulls gave up, allowing prices to hit 1995 lows of slightly above $1.50 after enduring a warmer-than-normal winter and persistent record highs in production.
Prior to Tuesday, the 73 consecutive trading days spent under the $2 mark was the longest such spell for gas in the past decade, after a 48-day stretch in 2016.
Storage Numbers Won’t Be Friendly
And the larger-than-normal supply build expected in the Energy Information Administration’s weekly storage report for gas at 10:30 AM ET (14:30 GMT) today makes an imminent return to $2 for front-month June look even more difficult.
A consensus of analysts tracked by Investing.com forecast that unseasonably warm weather and scant demand for heating prompted utilities to inject 106 billion cubic feet into storage for the week ended May 1. That compares with a 70 bcf injection in the previous week to April 24; a 96 bcf addition during the same week a year ago and a five-year (2015-2019) average build of 74 bcf.
“After adjusting to short-term impacts from the TETCO outage, a well-above average injection in the storage report will remind the market that near-term demand struggles are so far outweighing supply disruptions,” Dan Myers, analyst at Houston-based gas risk consultancy Gelber & Associates, wrote in a note to the company’s clients on Wednesday.
Myers added,
“Beyond the front month, the hefty surplus building early in the injection season carries strong implications for pricing in the 2020-21 winter."
Gas At A Crossroads After Easing Of Lockdowns
Lockdowns have eased across the U.S., stirring hopes of economic recovery, but natural gas is at a crossroads like other commodities. Just how much of demand will return and whether cooling forecasts made earlier for the summer were still valid is something no natgas trader or analyst can answer with certainty.
While that may be the case, the forward strip in gas from July onward is still above $2 for now, with the peak month being January 2021—or the coldest month anticipated for the coming winter—which hit a high of $3.09 on Wednesday.
Aside from uncertainties over commercial demand for gas, Henry Hub futures were also being weighed by worries over a spate of cancellations involving liquefied natural gas cargoes.
Up to 25 LNG cargoes for June were at risk, those in the know said last week.
“The large number of LNG cargoes being cancelled and potentially backing up into inventory in the U.S.” has shaped into a concern as significant for the market as the loss of commercial demand for power from the COVID-19, said Dominick Chirichella, director of risk and trading at the Energy Management Institute in New York.
U.S. LNG exports peaked at 8.1 billion cubic feet per day in January, reaching as many as 25 countries, just before COVID-19 hit the United States in a major way. That was the highest for U.S. LNG exports since record keeping began in 1997, said the EIA, which hasn’t published newer monthly data since.
* Disclaimer: Barani Krishnan does not own or hold a position in the commodities or securities he writes about.
