Key global market moves – rate fears rattle stocks
Global equities suffered a sharp fall in January as rising bond yields placed downward pressure on price-to-earnings valuations, especially among growth stocks.
The yield on U.S. 10-Year bonds surged 0.27 percentage points to 1.78%, as high U.S. inflation reports and hawkish commentary from U.S. Federal Reserve officials ratcheted up expectations of aggressive U.S. interest rate hikes this year. Global equity prices dropped 6.1%, while the $US firmed by 1%. Strength in Oil and agricultural prices saw commodities overall rise 6.6%.
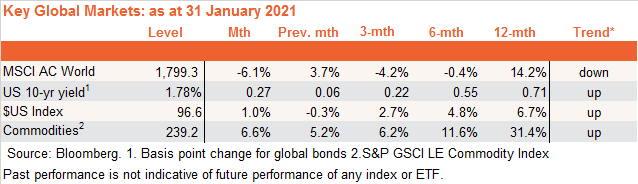
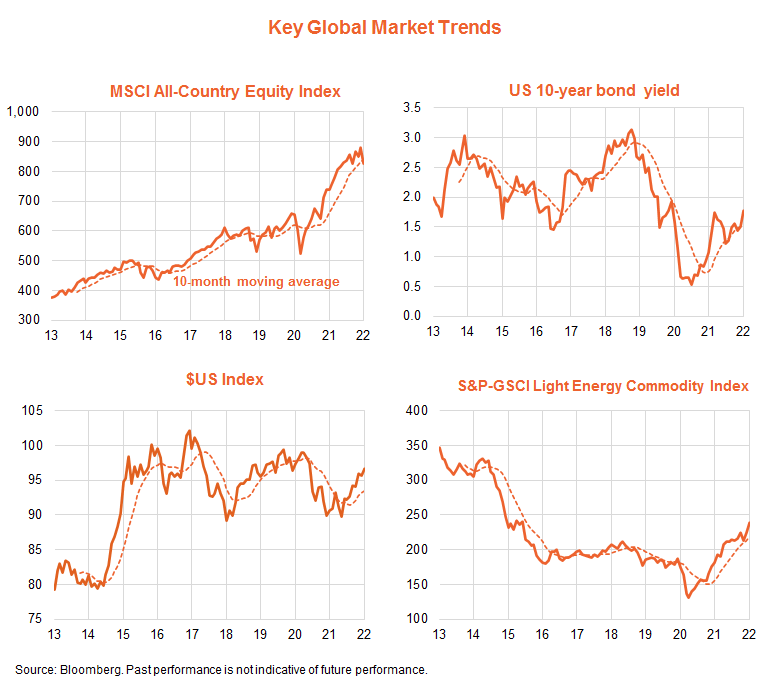
As evident in the chart set below, global equities dipped below their 10-month moving average for the first time since early 2020 – signalling a potential reversal of trend. The trend in bond yields, the U.S. dollar and overall commodities remains positive.
U.S. equity fundamentals – valuation challenges as rates rise further
Global equities are driven by U.S. equities, which in term are ultimately driven by fundamentals.
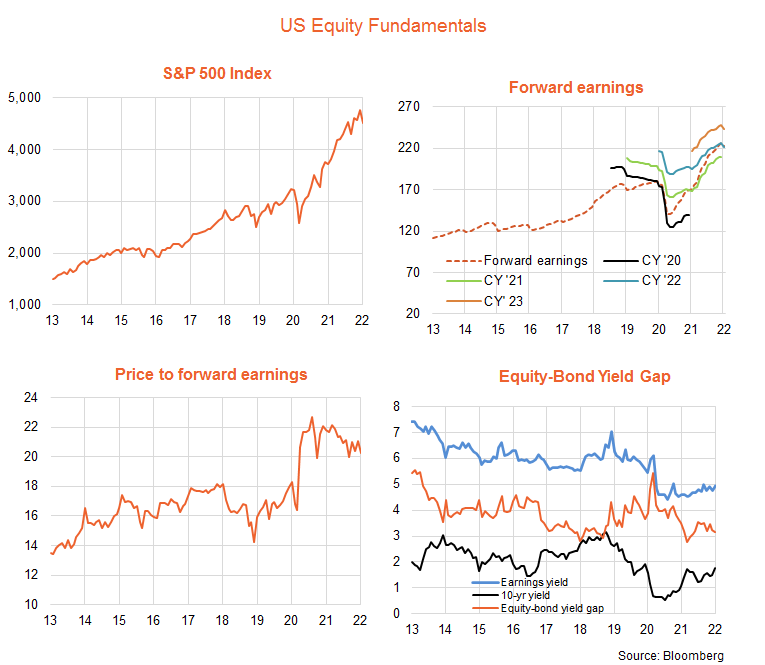
The U.S. S&P 500 price index fell 6.9% last month. As evident in the chart set below, this reflects both a drop in the price-to-forward earnings ratio and a small drop in forward earnings. The forward PE ratio dropped from 21.1 to 20.3 (-3.8%), while fear of higher interest also saw a small 2% fall in forward earnings.
The nearer-term fundamental picture for U.S. equities remains mixed. On the positive side, current expectations still suggest 9% growth in U.S. forward earnings by year-end. That said, the period of earnings upgrades may now be behind us, as growth slows and interest rates rise. Earnings downgrades are a potential new risk for the market.
Rising bond yields since late last year, moreover, have so far been largely met by a further narrowing in the earnings yield-to-bond yield gap (EBYG) from 3.5% to 3.2%, which is at the low end of its range of recent years. As a result, the PE ratio has only dropped modestly in recent months, to be still at 20.3 times earnings at end-January, compared to an average of 17.5 in recent years.
Based on Fed rate hikes, I still see U.S. 10-year bond yields eventually reaching around 2.25% by mid-year. If the earnings yield-to-bond yield gap (EBYG) holds at its present level of 3.2%, this lift in bond yields would drag down the PE ratio to around 18.3, or around 10% lower than its end-January level.
If the EBYG returns to its average of recent years at around 3.75%, it would imply a PE ratio of 16.6, or 18% below its end-January level.
Potential further downward valuation adjustments could largely negate gains from increased earnings, resulting in a fairly weak overall outlook for the major U.S. market for the year ahead.
Assuming the Fed persists with its intention to raise the Fed funds rate, key market uncertainties are:
- whether bond yields rise as much as expected given the predicted Fed rate hikes (as to some extent the latter could moderate current inflation concerns).
- even if bond yields rise, whether the EBYG continues to decline to help preserve PE valuations.
- whether earnings can hold up in the face of higher interest rates.
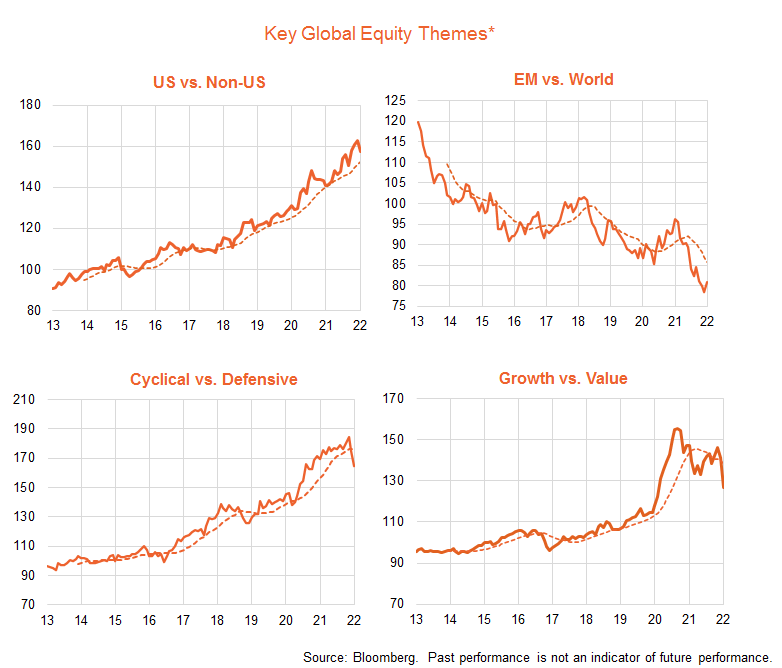
Global equity themes* – potential value opportunities
The chart set below outlines trends in several key ‘thematic tilts’ across global equity markets.
As evident, although U.S. market relative performance slipped a little last month, the trend still remains up. Similarly, while emerging markets enjoyed a relative performance bounce the trend so far at least remains downwards. There has been a clearer trend shifts in terms of factors/sectors – with cyclical sectors turning down relative to defensive sectors, and value again beginning to outperform growth.
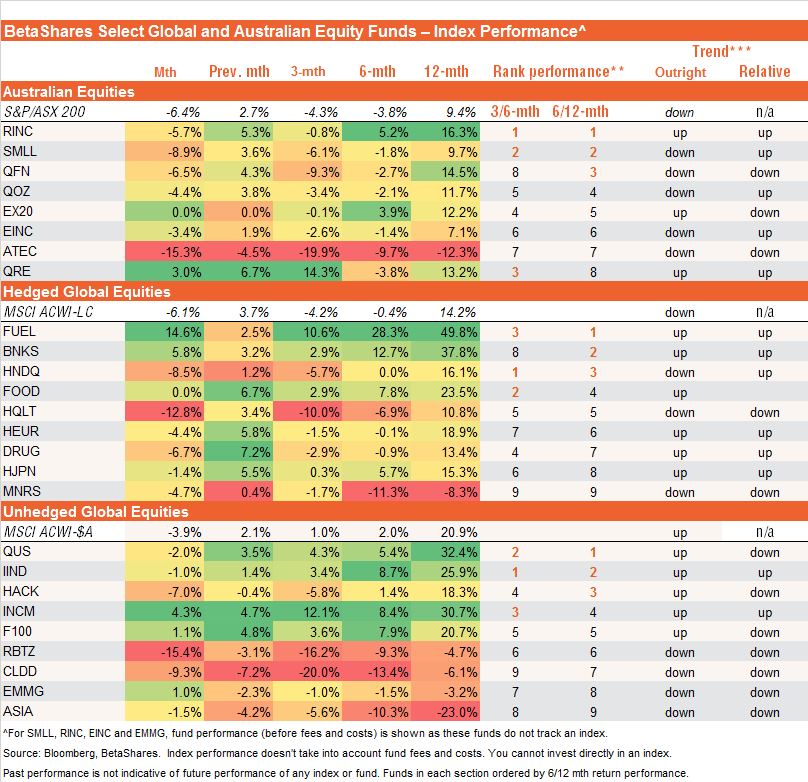
ETF performance snapshot
The table below sets out a selected list of BetaShares ETFs across various regional, sector and factor thematics.
In Australia, some key ETF sector themes are as follows:
- The relative performance of the resources sector (ASX:QRE) has bounced back in recent months in line with a bounce in Iron ore prices as China switched to easing credit conditions.
- The relative performance of the local technology sector (ASX:ATEC) remains negative, in line with the global technology sell-off in the face of higher bond yields.
- After outperforming during the late-2020/early-2021 ‘re-opening trade’, the relative performance of local financials (ASX:QFN) has levelled out in recent months.
Globally, some key ETF sector themes are as follows:
- Value clearly outperformed growth last month, reflected in good gains in banks (ASX:BNKS) and energy producers (ASX:FUEL) relative to the NASDAQ-100 (ASX:HNDQ). Quality (HQLTY) also had a relatively sharp downturn in the month, reflecting some exposure to smaller-cap technology companies.
- Defensive sectors performed relatively well, with modest gains in global high income ASX:INCM) and the UK stocks (ASX:F100).
- Along with the pull back in growth/technology generally, there was weakness among technology thematics such as cybersecurity (ASX:HACK), cloud computing (ASX:CLDD) and robotics/AI (ASX:RBTZ).