There's likely no end to the probable fallout from plunging oil prices, including possible serious damage to companies that specialize in exploration, drilling and production. As well, oil exporting countries such as Russia, Norway and Canada could also see some serious blowback from the declines. Australia, which exports both oil and natural gas, and has an already shaky economy, might be in double jeopardy.
The most obvious, leading indicator of trouble ahead for each of these countries, is the state of their FX, which for the list above, shows each national currency struggling significantly today, weighed by crude's vicious 30% overnight plunge.

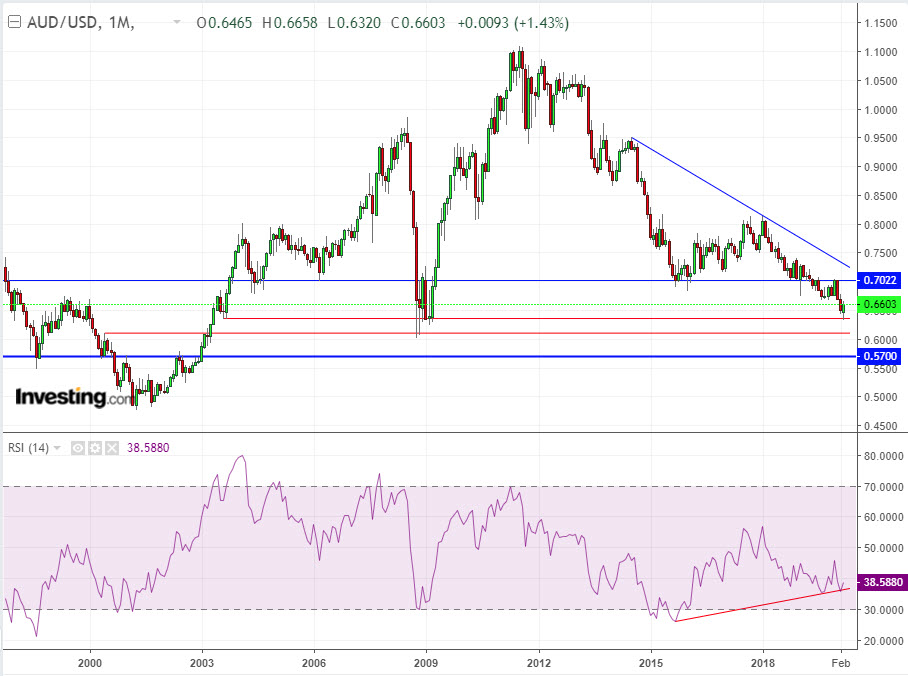
The Australian dollar tumbled today, earlier down 5%, though it's recovered to just -0.5%. It may not only be oil-related pressures triggering the Aussie's moves. The Reserve Bank of Australia, the country's central bank, last week cut rates from 0.75% to 0.50%, a moved that surprised traders. Bloomberg predicts the country's GDP will shrink over the next 2 quarters, in part because its biggest trading partner, China, which receives 32% of Australia's exports, is currently in lockdown because of the coronavirus.
From a technical perspective, two immediate support levels are visible—around 0.6360, then 0.6100. A strong support level around 0.57 would be the next move, a historical neckline of a reverse head-and-shoulders pattern.
Should the price go higher, a possible resistance resides around 0.70.

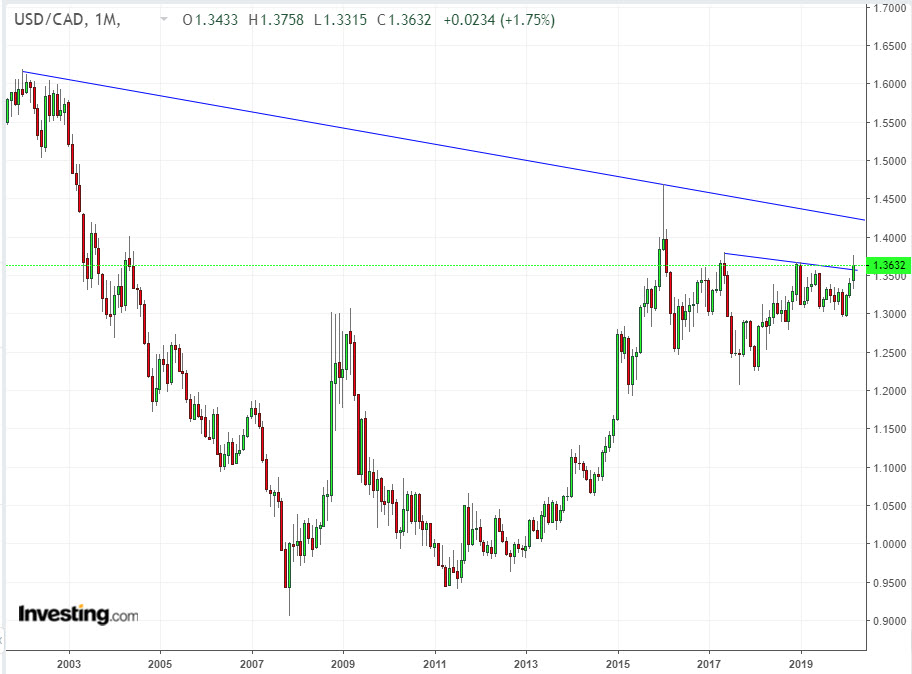
The USD/CAD pair is still pushing higher on the monthly chart, with the Canadian dollar gapping up on the daily chart, above the first blue trendline, with the higher trendline as a potential next target. This is occurring not only because of oil's immediate moves, but also in the aftermath of an interest rate cut by the BoC on March 4, worse than expected trade numbers released last Friday and the central bank's warning of a serious test to Canada's economy by the global outbreak of the coronavirus.

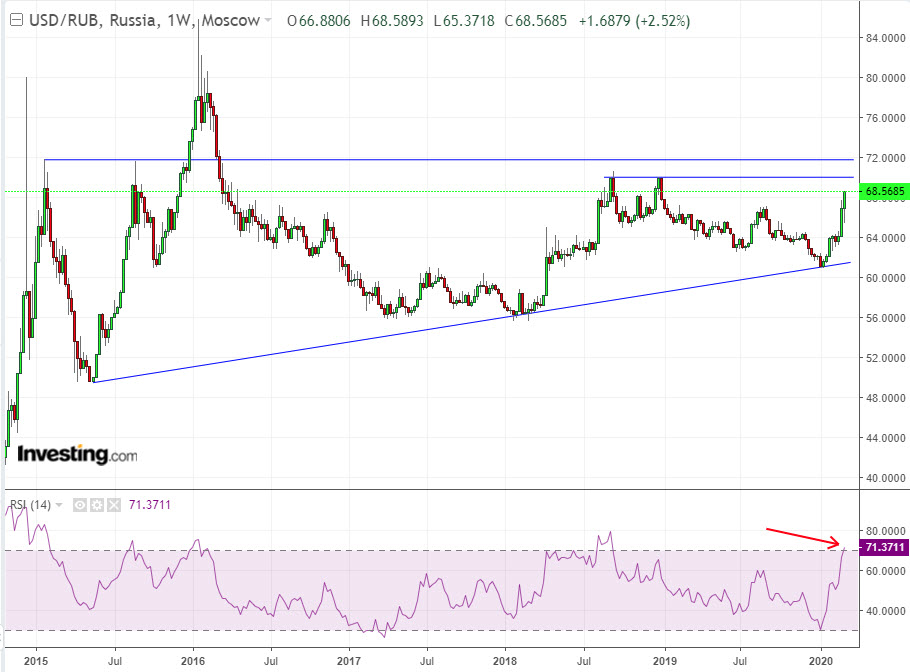
The newly opened price war between Russia and Saudi Arabia will undoubtedly hit Russia's oil-dependent economy hard. On the monthly chart the USD/RUB is pushing up into a big rising triangle. Immediate resistance for the ruble is at 70 and 71.75. The RSI is already heading into overbought territory, though in the past that's never stopped the currency pair from pushing much higher.
If the 71.75 level is breached, we could see USD/RUB go up to 75 and even 80.

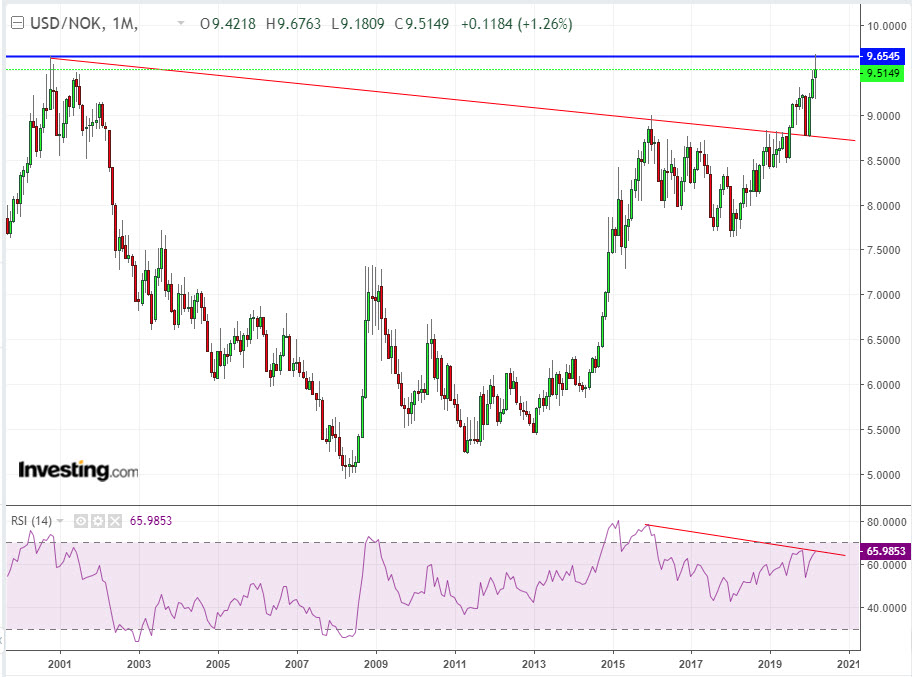
Norway's krone touched the historical level of 9.65 during October 2000. Though the European country's economy remains strong, sustained lows for oil could change that equation.
Right now the USD/NOK is holding below the resistance line (blue) on the monthly chart. It remains to be seen whether the monthly candle closes below the 9.65 level or above it. Should it close below that historical level, it may head lower to retest the red trend line around 8.75.
