Breaking News
Investing Pro 0
🚨 NDVA surged 43%. This AI Chipmaker Could Be Next See Analysis

Is The Small Cap Rally Almost Over?

By Michael KramerMarket OverviewFeb 12, 2021 20:55
au.investing.com/analysis/is-the-small-cap-rally-almost-over-200448137
Is The Small Cap Rally Almost Over?
By Michael Kramer   |  Feb 12, 2021 20:55
Saved. See Saved Items.
This article has already been saved in your Saved Items
 
 
US2000
-0.99%
Add to/Remove from a Portfolio
Add to Watchlist
Add Position

Position added successfully to:

Please name your holdings portfolio
 
GME
-2.12%
Add to/Remove from a Portfolio
Add to Watchlist
Add Position

Position added successfully to:

Please name your holdings portfolio
 
IWM
-0.99%
Add to/Remove from a Portfolio
Add to Watchlist
Add Position

Position added successfully to:

Please name your holdings portfolio
 
NVAX
+8.34%
Add to/Remove from a Portfolio
Add to Watchlist
Add Position

Position added successfully to:

Please name your holdings portfolio
 
PLUG
-5.88%
Add to/Remove from a Portfolio
Add to Watchlist
Add Position

Position added successfully to:

Please name your holdings portfolio
 

This article was written exclusively Investing.com

The Russell 2000 has surged since the start the year. The small-cap index is up nearly 16% since Jan. 1, and is almost 54% higher since Nov. 3 2020. The move higher has been driven by hopes of stimulus and a recovering US economy. But there may be more to the rally than just hope and optimism. Beneath the surface is a short squeeze taking place for months, and now options traders are betting that the rally is coming to an end. 

Stocks like Plug Power (NASDAQ:PLUG), GameStop (NYSE:GME), and Novavax (NASDAQ:NVAX) account for 3 of the top 4 positions in the iShares Russell 2000 ETF (NYSE:IWM), a tracking ETF of the Russell index. These stocks are also part of the Refinitiv Most Shorted Index. They are among some of the most heavily shorted names in the market. As many already know, these stocks and more have soared, creating an epic squeeze, with short sellers being forced to scramble and cover their positions. 

Shorts Surge

Since Mar. 23, 2020, the Russell 2000 index has risen by more than 125%, while the Refinitiv most shorted index has climbed by more than 200%. The Russell 2000 has received a big lift from many heavily shorted stocks. Just this year, the most shorted index has been driven higher by Game Stop, Novavax, and Plug Power, all up by 80% or more. 
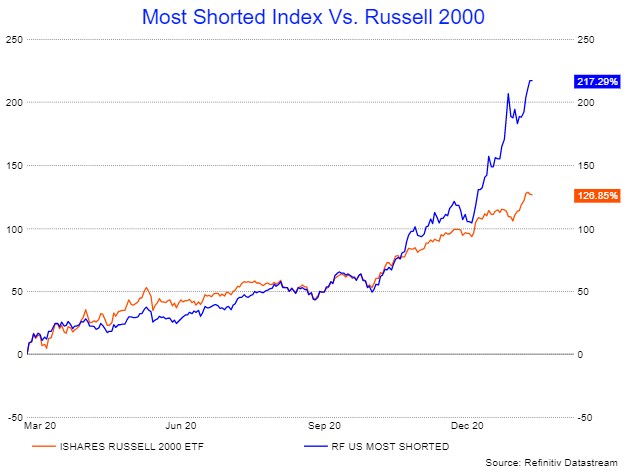
Most Shorted Index V Russell 2000

Bearish Options Trade

However, there are now options traders betting that this big rally will come to an end and soon. On Feb. 8, the open interest for the IWM Mar. 19 $215 puts rose by almost 33,000 contracts. The data shows the contracts were bought for around $4.40, with premiums paid of more than $14 million. It is a bet that the ETF is trading below $211 by the middle of March, a drop of almost 7%. 

That was not the only bearish bet. On Feb. 9, the open interest for the IWM Mar. 19, $218 put options spiked by more than 21,000 contracts. Those puts were bought too, for about $4.65 per contract, suggesting the ETF trades below $213.35 by the middle of March.  

Momentum May Be Shifting

The options bets are not the only warning signs. The technical patterns also suggest a reversal may be in the works. The ETF has reached the upper trendline of a broadening wedge pattern, which may have also completed a 5-wave count cycle. This may result in the ETF retracing much of its recent gains and falling back to its lower trend line around a price of $205. That would amount to a decline of more than 9%.  

The relative strength index is also flashing a warning sign, and as hit, overbought conditions rising above 70. Additionally, a bearish divergence has formed, as the ETF's price has made a new high while the RSI has made a lower high.  
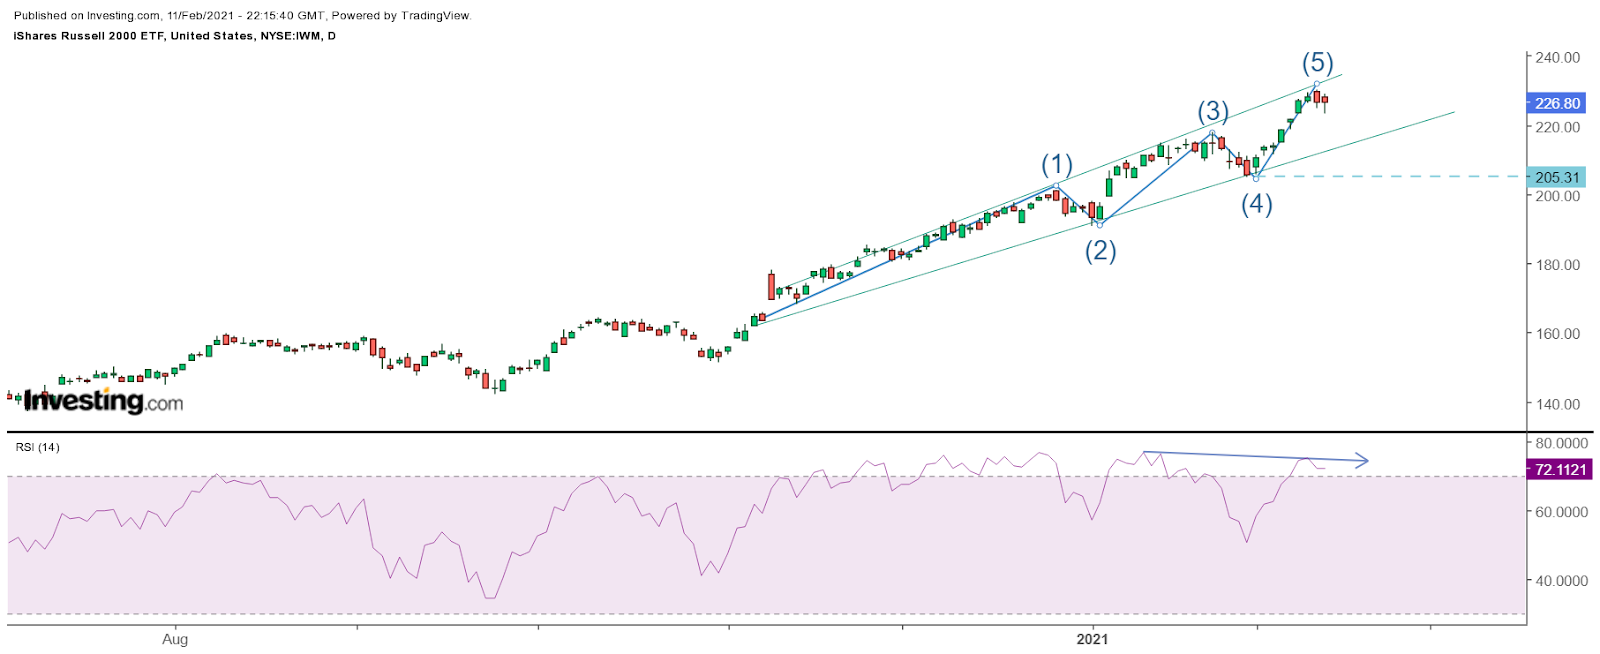
Russell 2000 Daily
Russell 2000 Daily
The diverging pattern is typically present when momentum is starting to change, and momentum has certainly been behind this group's epic rise. The momentum has been sparked by the promise of economies reopening while receiving a boost from trillions of dollars in fiscal and economic relief. Whether the rally can continue for longer at this current pace is yet to be seen.  

However, if there is a trend reversal, it should not come as a surprise, as stocks don't always go up and tend to fall even faster. 

Is The Small Cap Rally Almost Over?
 

Related Articles

Is The Small Cap Rally Almost Over?

Add a Comment

Comment Guidelines

We encourage you to use comments to engage with users, share your perspective and ask questions of authors and each other. However, in order to maintain the high level of discourse we’ve all come to value and expect, please keep the following criteria in mind: 

  • Enrich the conversation
  • Stay focused and on track. Only post material that’s relevant to the topic being discussed.
  • Be respectful. Even negative opinions can be framed positively and diplomatically.
  •  Use standard writing style. Include punctuation and upper and lower cases.
  • NOTE: Spam and/or promotional messages and links within a comment will be removed
  • Avoid profanity, slander or personal attacks directed at an author or another user.
  • Don’t Monopolize the Conversation. We appreciate passion and conviction, but we also believe strongly in giving everyone a chance to air their thoughts. Therefore, in addition to civil interaction, we expect commenters to offer their opinions succinctly and thoughtfully, but not so repeatedly that others are annoyed or offended. If we receive complaints about individuals who take over a thread or forum, we reserve the right to ban them from the site, without recourse.
  • Only English comments will be allowed.

Perpetrators of spam or abuse will be deleted from the site and prohibited from future registration at Investing.com’s discretion.

Write your thoughts here
 
Are you sure you want to delete this chart?
 
Post
Post also to:
 
Replace the attached chart with a new chart ?
1000
Your ability to comment is currently suspended due to negative user reports. Your status will be reviewed by our moderators.
Please wait a minute before you try to comment again.
Thanks for your comment. Please note that all comments are pending until approved by our moderators. It may therefore take some time before it appears on our website.
 
Are you sure you want to delete this chart?
 
Post
 
Replace the attached chart with a new chart ?
1000
Your ability to comment is currently suspended due to negative user reports. Your status will be reviewed by our moderators.
Please wait a minute before you try to comment again.
Add Chart to Comment
Confirm Block

Are you sure you want to block %USER_NAME%?

By doing so, you and %USER_NAME% will not be able to see any of each other's Investing.com's posts.

%USER_NAME% was successfully added to your Block List

Since you’ve just unblocked this person, you must wait 48 hours before renewing the block.

Report this comment

I feel that this comment is:

Comment flagged

Thank You!

Your report has been sent to our moderators for review
Continue with Google
or
Sign up with Email