The figures coming out of China are mixed. Industrial production is decelerating and missed expectations; fixed asset investment slowed, but was in line with expectations; and retail sales rose and beat expectations. The overall picture is a slowing industrial, export and infrastructure spending and an upbeat household sector.
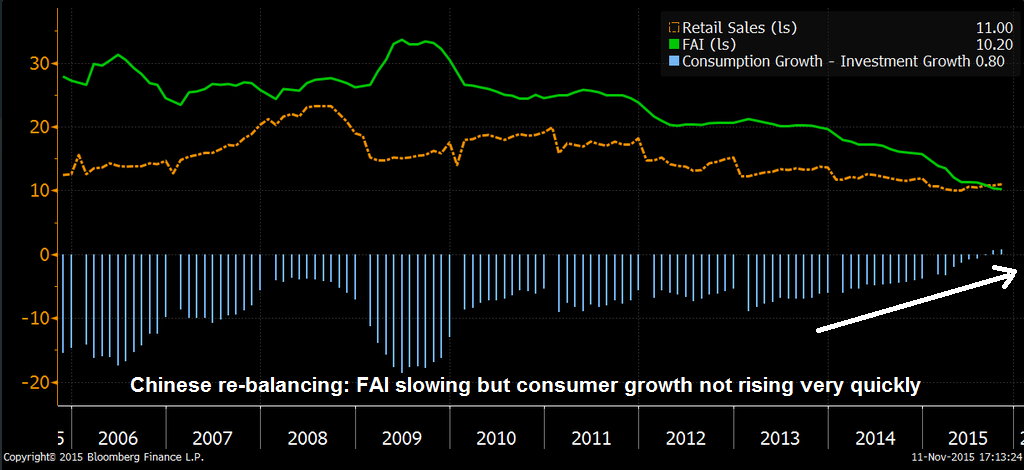
Tom Orlik summarized it as a good news and bad news story. The good news is the Chinese economy is re-balancing growth towards the consumer, but FAI is slowing and consumer growth isn't rising very quickly to make up for the lost growth in other areas (annotations in white are mine):
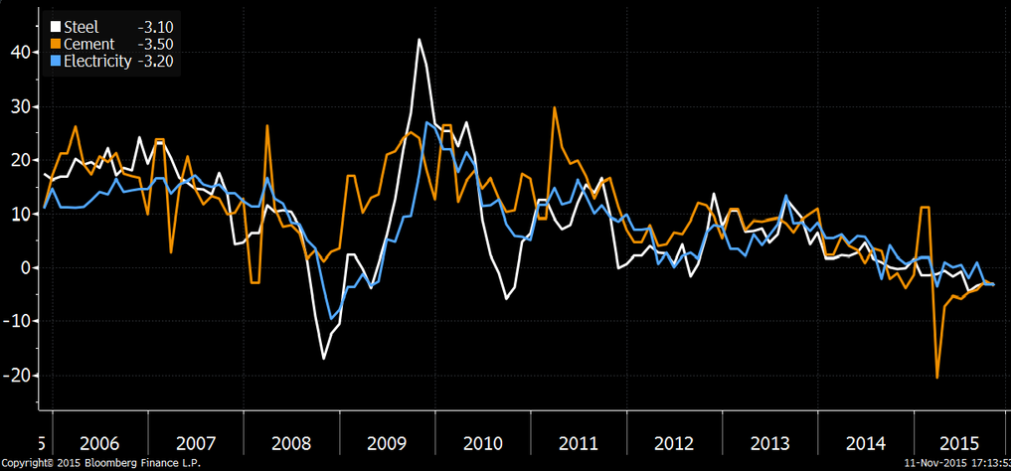
In the below chart we can see that Old China style growth—powered by credit driven infrastructure spending—is decelerating along a number of dimensions:
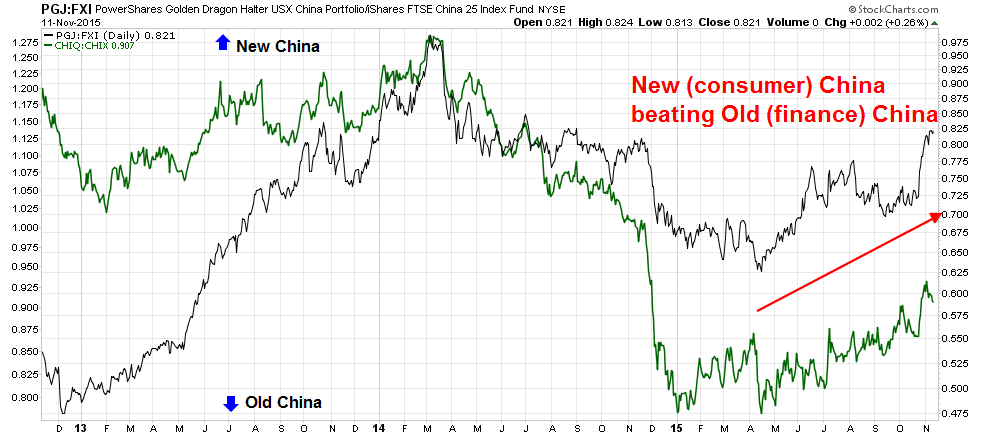
I have written about China re-balancing before by highlighting this pair chart of Old China-New China ETF pairs, PowerShares Golden Dragon China Port (N:PGJ) : iShares China Large-Cap (N:FXI) vs Global X China Consumer (N:CHIQ) : Global X China Financials (N:CHIX). When the lines are rising, New China, consumer-led growth stocks are outperforming and, when the lines are falling, Old China, credit-driven infrastructure growth is ascendant. We have seen the New China stocks begin to outperform in April and they haven't looked back since.
What about the slowdown?
Many investors I have talked to are bewildered by the China bull and bear debate. The bulls will point to evidence of re-balancing as a positive sign for the Chinese growth outlook, as exemplified by Alibaba's (N:BABA) Singles' Day sales of USD 14.3 billion, which surpassed last year's sales of USD 9.3 billion. The bears, on the other hand, will contend that, at the end of the day, Chinese growth is still slowing.
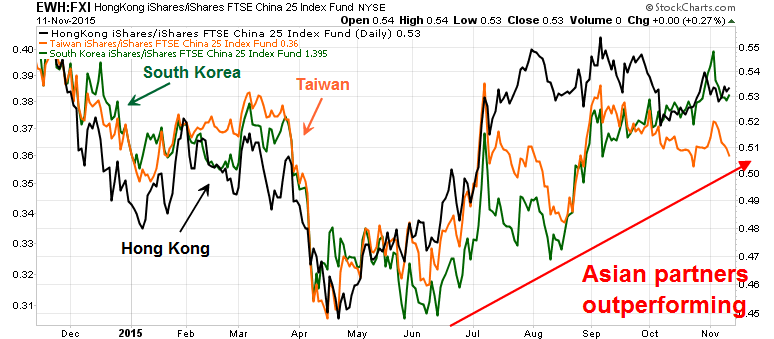
To settle the argument, I turned to Mr. Market for his verdict. The chart below shows the relative performance of the stock markets of China's major Asian trading partners, Hong Kong, Taiwan and South Korea, relative to the Chinese market. I used USD denominated ETFs—iShares MSCI Hong Kong (N:EWH), iShares MSCI Taiwan (N:EWT) and iShares MSCI South Korea Capped (N:EWY) to filter out any currency effects and used FXI as the proxy for China.
As the chart indicates, the major Asian market ETFs that trade and export to China are all outperforming FXI. If Mr. Market was indeed worried about a China slowdown affecting her Asian trading partners, then these markets would be under-performing.
If the market doesn't seem to be all that worried about China slowdown, should you?
Disclosure: Cam Hui is a portfolio manager at Qwest Investment Fund Management Ltd. (""Qwest""). This article is prepared by Mr. Hui as an outside business activity. As such, Qwest does not review or approve materials presented herein. The opinions and any recommendations expressed in this blog are those of the author and do not reflect the opinions or recommendations of Qwest.
None of the information or opinions expressed in this blog constitutes a solicitation for the purchase or sale of any security or other instrument. Nothing in this article constitutes investment advice and any recommendations that may be contained herein have not been based upon a consideration of the investment objectives, financial situation or particular needs of any specific recipient. Any purchase or sale activity in any securities or other instrument should be based upon your own analysis and conclusions. Past performance is not indicative of future results. Either Qwest or Mr. Hui may hold or control long or short positions in the securities or instruments mentioned."


