Breaking News
Investing Pro 0
Final hours: unlock premium data with Claim 60% OFF

How High Can Bond Yields Go Before Crashing the Nasdaq 100?

By Investing.com (Damian Nowiszewski)Market OverviewAug 25, 2023 19:01
au.investing.com/analysis/how-high-can-bond-yields-go-before-crashing-the-nasdaq-100-200576763
How High Can Bond Yields Go Before Crashing the Nasdaq 100?
By Investing.com (Damian Nowiszewski)   |  Aug 25, 2023 19:01
Saved. See Saved Items.
This article has already been saved in your Saved Items
 
 
NDX
+0.39%
Add to/Remove from a Portfolio
Add to Watchlist
Add Position

Position added successfully to:

Please name your holdings portfolio
 
NVDA
+1.95%
Add to/Remove from a Portfolio
Add to Watchlist
Add Position

Position added successfully to:

Please name your holdings portfolio
 
US10Y...
+2.43%
Add to/Remove from a Portfolio
Add to Watchlist
Add Position

Position added successfully to:

Please name your holdings portfolio
 
  • US 10-year bonds have reached the highest levels since 2007
  • PMIs for the US economy continue to show a negative trend
  • Meanwhile, a bearish session for the Nasdaq 100 indicates a high risk of further declines

Earlier this week, US 10-year yields reached 4.36%, the highest point in over a decade. This comes as part of a medium-term upward trend that began in April of this year, fueled by both fundamental and technical factors.

The market's concern about rising inflationary pressures and their impact on monetary policy is the primary driver behind the bonds' rally. Currently, the probability of another hike is increasing and is already above 40% for the Fed's November meeting.
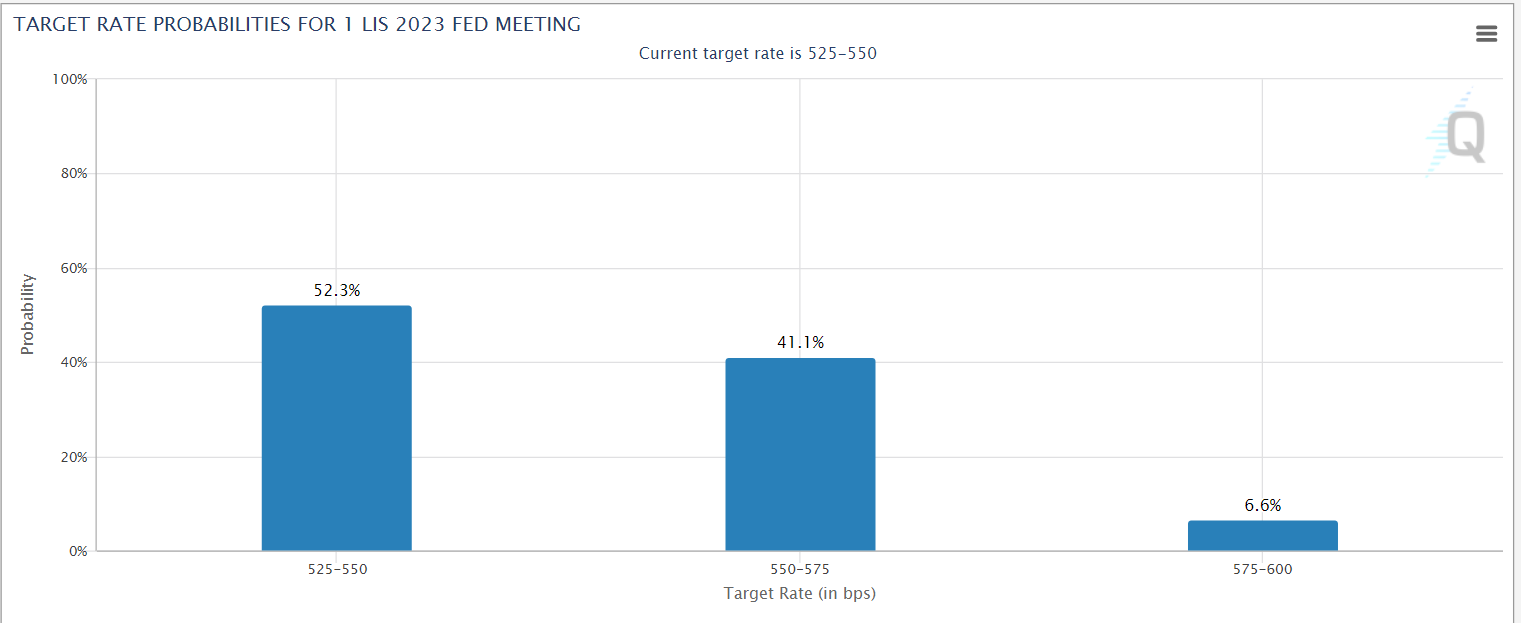
Target Rate Probabilities
Source: www.cmegroup.com

As a result, US stock indexes are having a challenging week, and yesterday's weak trading session could potentially further reinforce the downward trend — despite the highly positive surprise in Nvidia's (NASDAQ:NVDA) earnings.

However, the final verdict for the weeks ahead remains uncertain until the culmination of the Jackson Hole symposium later today and Federal Reserve Chair Jerome Powell's speech.

Where Will US 10-Year Bonds Stop?

The U.S. bond market is sending a clear signal that the fight against inflation may be much more challenging than previously expected. Although the 10-year has rebounded lower in recent sessions, the upward trend is still in effect.
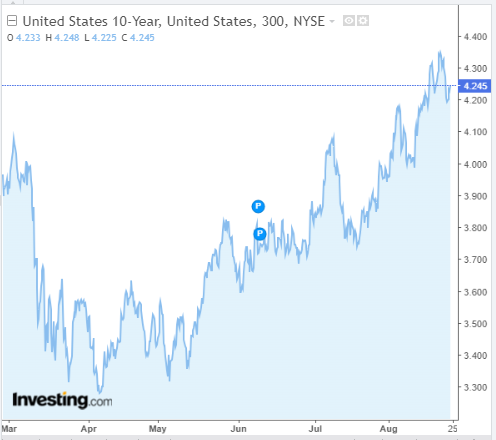
US 10-Year 5-Hour Chart

The latest CPI readings were slightly better than forecast but showed the first monthly y/y increase since last July.
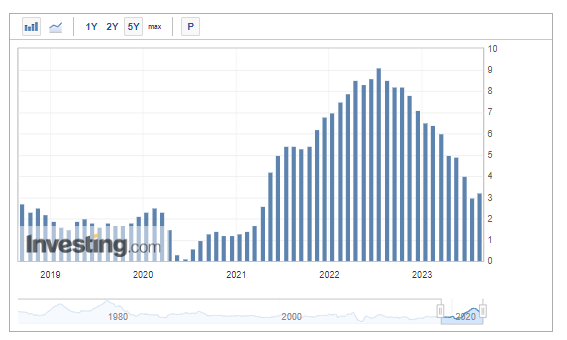
US CPI YoY
US CPI YoY

This indicates that even though there was solid advancement in the first half of the year, achieving the 2% target will be akin to climbing an 8,000-meter peak. As you ascend, gaining additional meters—here, percentage points—becomes progressively harder. If upcoming readings confirm the trend reversal, it might lean towards another interest rate hike.

US Services PMIs Approach 50-Point Mark

Apart from GDP, the main factors that indicate the well-being of an economy, namely the services and manufacturing PMIs, are still giving us no reason to feel upbeat. The figures released this week for July were notably lower than predicted, especially concerning services. This aspect could play a pivotal role in maintaining inflation dynamics above the target.

US Manufacturing PMI
US Services PMI
US Services PMI

The services sector is showing more resilience compared to the manufacturing sector and remains above the critical 50-point threshold that distinguishes growth from slowdown. When it comes to tackling inflation, it would be beneficial to see a string of negative readings persist, as this would indicate slowing economic activity and abating inflationary pressures.

Nasdaq 100: Bears Remain in Control

Earlier in the week, there seemed to be an opportunity to wrap up the correction as the pace of declines eased and the Nasdaq 100 had a rebound. However, yesterday's trading session, where more than half of the upward recovery was wiped out, indicated that the bears still hold sway.

This suggests the possibility of further declines from this point. The bears have a fairly wide margin for downward movement, given that the closest support level lies just below 14,000 points within a significant support zone.
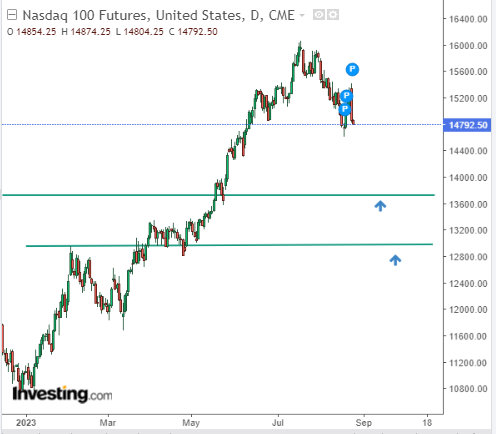
Nasdaq 100 Daily Chart

If the bearish situation unfolds, paying close attention to the supply-side dynamics would be prudent. In case of a correction to the upside, a move toward previous support areas would be good signal to consider long positions.

***

Disclaimer: This article is written for informational purposes only; it does not constitute a solicitation, offer, advice, counseling or recommendation to invest as such it is not intended to incentivize the purchase of assets in any way. I would like to remind you that any type of assets, is evaluated from multiple points of view and is highly risky and therefore, any investment decision and the associated risk remains with the investor.

How High Can Bond Yields Go Before Crashing the Nasdaq 100?
 

Related Articles

Chris Becker
08.12.23 Macro Afternoon By Chris Becker - Dec 08, 2023

Asian share markets are in mixed form going into the final session of the week as Yen tries to stabilise following big gains against USD while risk sentiment in China remains quite...

How High Can Bond Yields Go Before Crashing the Nasdaq 100?

Add a Comment

Comment Guidelines

We encourage you to use comments to engage with users, share your perspective and ask questions of authors and each other. However, in order to maintain the high level of discourse we’ve all come to value and expect, please keep the following criteria in mind: 

  • Enrich the conversation
  • Stay focused and on track. Only post material that’s relevant to the topic being discussed.
  • Be respectful. Even negative opinions can be framed positively and diplomatically.
  •  Use standard writing style. Include punctuation and upper and lower cases.
  • NOTE: Spam and/or promotional messages and links within a comment will be removed
  • Avoid profanity, slander or personal attacks directed at an author or another user.
  • Don’t Monopolize the Conversation. We appreciate passion and conviction, but we also believe strongly in giving everyone a chance to air their thoughts. Therefore, in addition to civil interaction, we expect commenters to offer their opinions succinctly and thoughtfully, but not so repeatedly that others are annoyed or offended. If we receive complaints about individuals who take over a thread or forum, we reserve the right to ban them from the site, without recourse.
  • Only English comments will be allowed.

Perpetrators of spam or abuse will be deleted from the site and prohibited from future registration at Investing.com’s discretion.

Write your thoughts here
 
Are you sure you want to delete this chart?
 
Post
Post also to:
 
Replace the attached chart with a new chart ?
1000
Your ability to comment is currently suspended due to negative user reports. Your status will be reviewed by our moderators.
Please wait a minute before you try to comment again.
Thanks for your comment. Please note that all comments are pending until approved by our moderators. It may therefore take some time before it appears on our website.
 
Are you sure you want to delete this chart?
 
Post
 
Replace the attached chart with a new chart ?
1000
Your ability to comment is currently suspended due to negative user reports. Your status will be reviewed by our moderators.
Please wait a minute before you try to comment again.
Add Chart to Comment
Confirm Block

Are you sure you want to block %USER_NAME%?

By doing so, you and %USER_NAME% will not be able to see any of each other's Investing.com's posts.

%USER_NAME% was successfully added to your Block List

Since you’ve just unblocked this person, you must wait 48 hours before renewing the block.

Report this comment

I feel that this comment is:

Comment flagged

Thank You!

Your report has been sent to our moderators for review
Continue with Google
or
Sign up with Email