This article was written exclusively for Investing.com
The small-cap Russell 2000 has struggled of late, unable to push to record highs like the large-cap peers. Based on some recent options trades, which indicate lower prices are on the horizon, the trouble may only be starting. It leaves the iShares Russell 2000 ETF (NYSE:IWM) vulnerable to a pullback of as much as 8% from its current price of approximately $228.
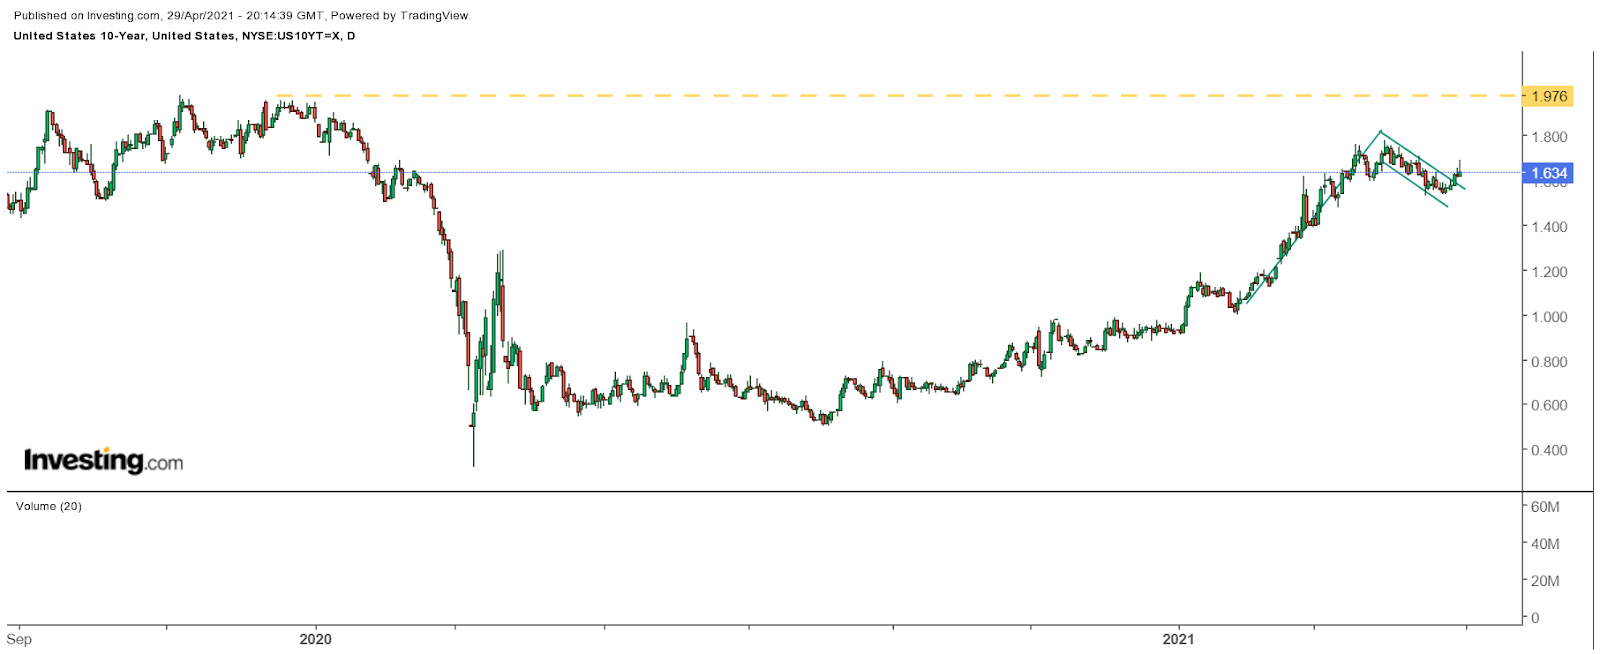
This bearish outlook for the small caps could be a result of nervousness that inflation rates will move higher, resulting in lower margins, especially if all of the costs weren’t passed on to the consumer. Bond yields look as if they are getting ready to move significantly higher from here. The first week of May could provide that spark with a slew of inflation-sensitive data due to be released.
Higher Rates
With the Fed intent on keeping accommodative monetary policy and getting inflation rates higher, there is plenty of room for interest rates to go up. The technical charts show bullish patterns in 5,7,10, and 30-year interest rates. The patterns all resemble bull flags which are in the process of breaking free of their current trading channel. It could even result in the 10-year taking out its previous highs and heading towards 2%.

Higher inflation rates could squeeze profit margins, especially for some of these small-cap stocks that are more sensitive to higher prices in supply chains. Lower margins would suppress earnings growth and reduce earnings multiples across the small-cap sector.
Betting Small Caps Drop
Options traders have been betting bearishly over the past few trading sessions, indicating lower prices for the small-cap sector. On Apr. 28, open interest levels for the June 18 IWM $227 calls increased by about 8,300 contracts and were purchased for around $7.50. This indicates that the ETF is trading below $121 by the middle of June. Additionally, some are betting it falls even further; on Apr. 26, the open interest for the June $215 puts increased by more than 17,000 contracts and purchased for around $4.80 per contract. It would imply the IWM is trading around $110 by the expiration date, which is a drop of about 8%.
The technical chart for the IWM is currently suggesting trouble may be ahead too. There is a potential head and shoulders reversal pattern that has been forming on the chart. It may be too soon to confirm the bearish pattern, but it certainly should be monitored closely. A confirmation of the bearish pattern would not be achieved until the IWM fell below $207. While traders aren’t betting on a drop that large, a retest of that support level is certainly possible and would fit in with the narrative discussed above.
More Inflation
If the Fed gets its wish for a sustainable inflation rate that averages 2% for some time, it likely means that yields on the long end of the curve have only one way to go, and that is higher. Unless the Fed institutes yield curve control, which seems unlikely, then rates will have to go up from here. That explains why the bond market is currently positioned in a bullish tone for rates.
At the same time, higher inflation rates are likely to squeeze margins for some smaller companies, especially if they cannot pass all of those rising costs on to their consumers. Overall, it could mean that the sector is in for a lower price, especially if the bond market’s view proves to be the correct one.
