- Investing in the stock market can be challenging due to the volume and complexity of financial data. However, knowing and understanding these figures is crucial when investing as they reflect the financial health of a company.
- Tools such as InvestingPro make it easy to analyze this data, offering graphs and statistics to simplify indicators such as EBITDA, ROE, ROI, and Debt/Equity ratio.
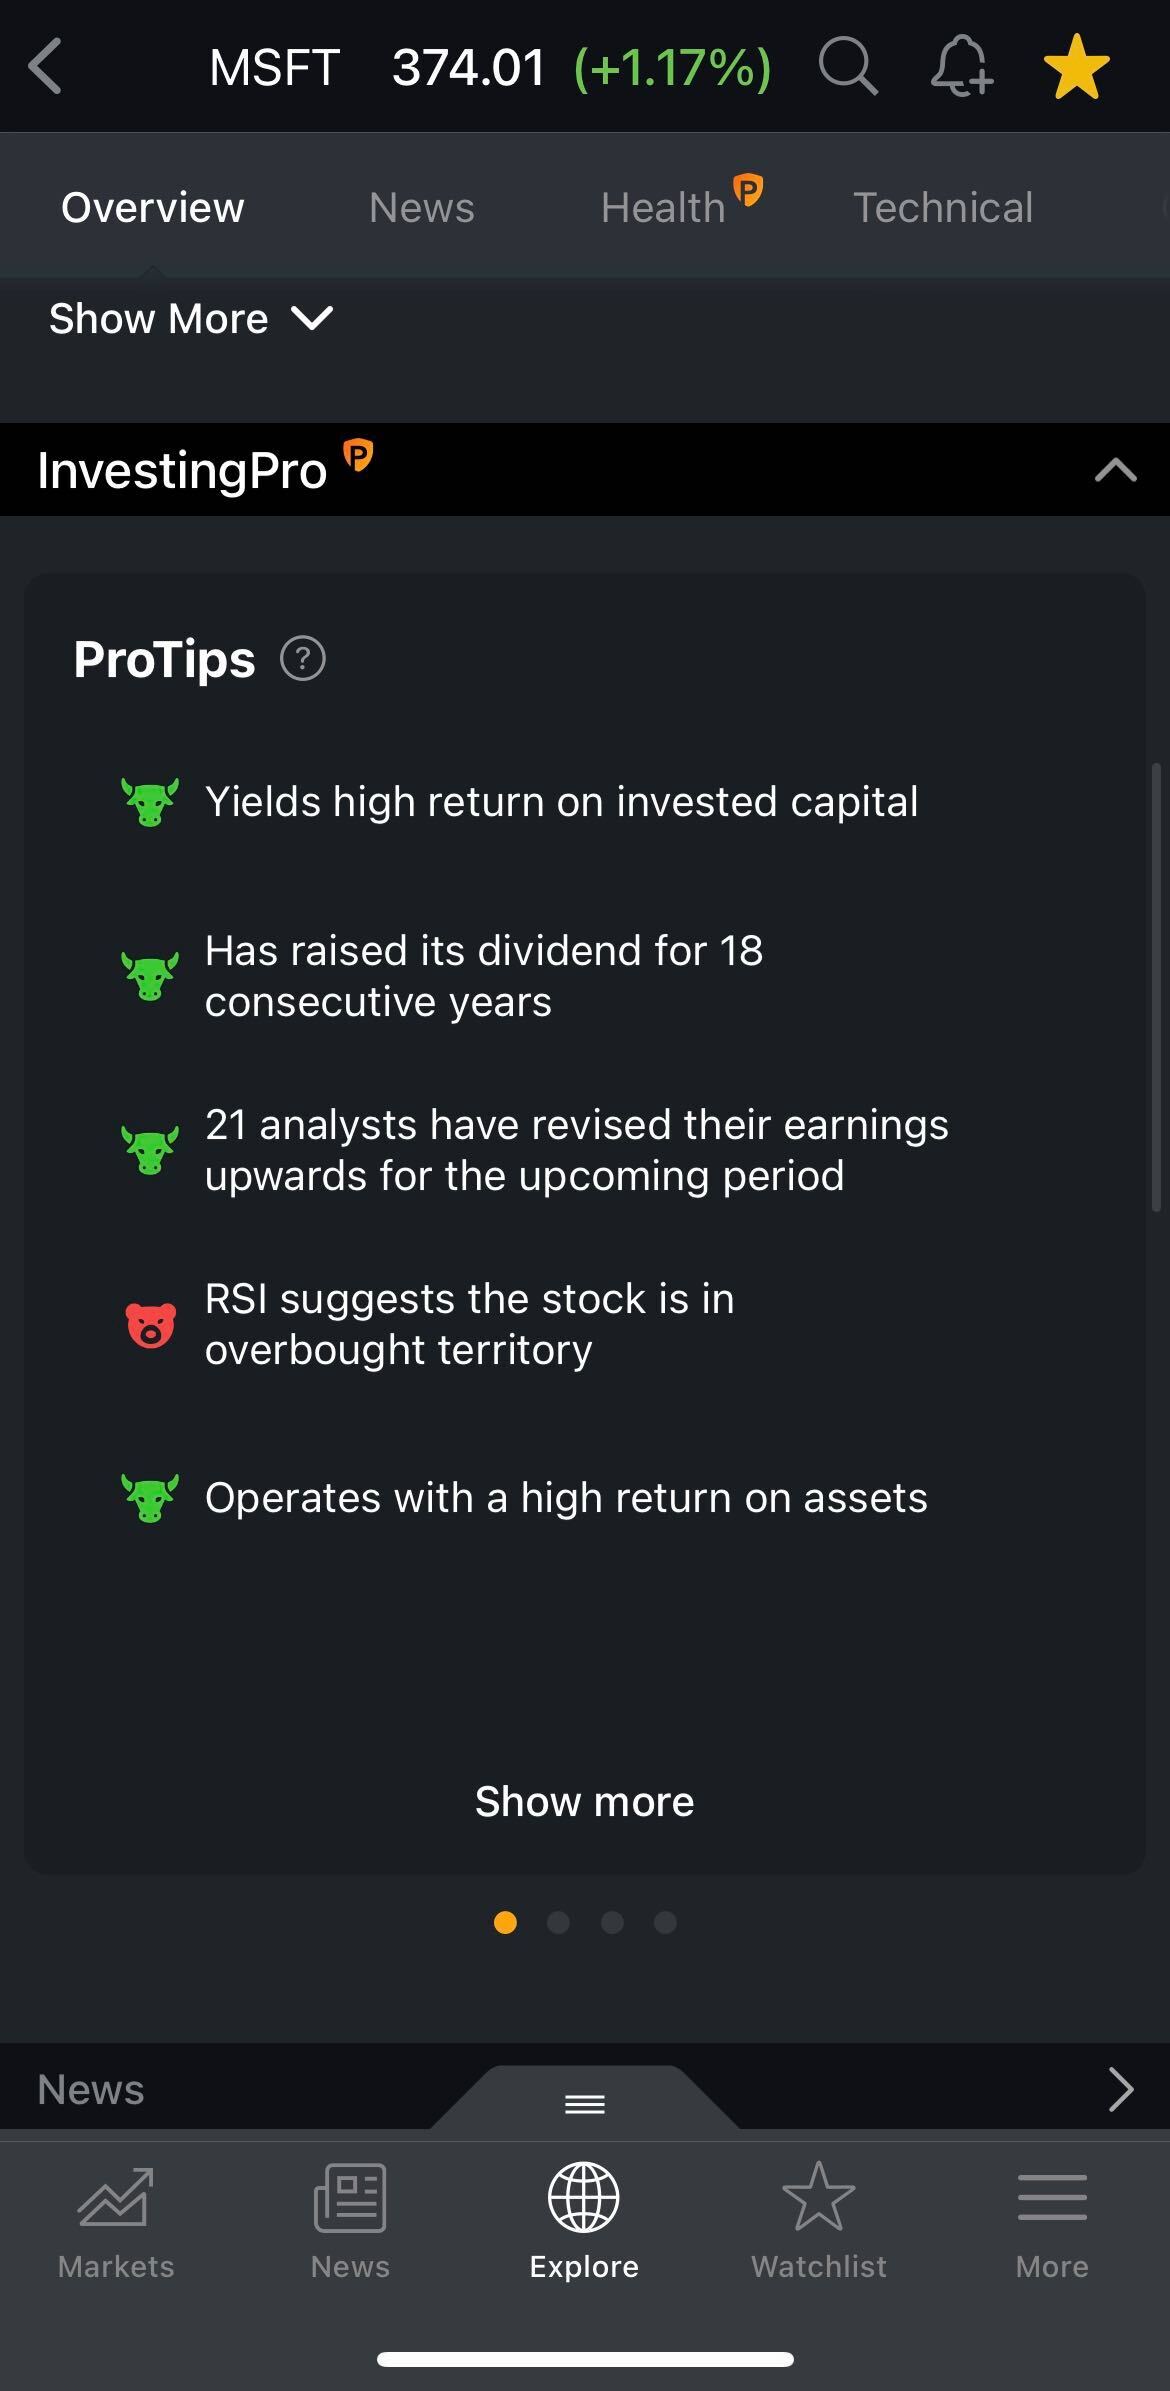
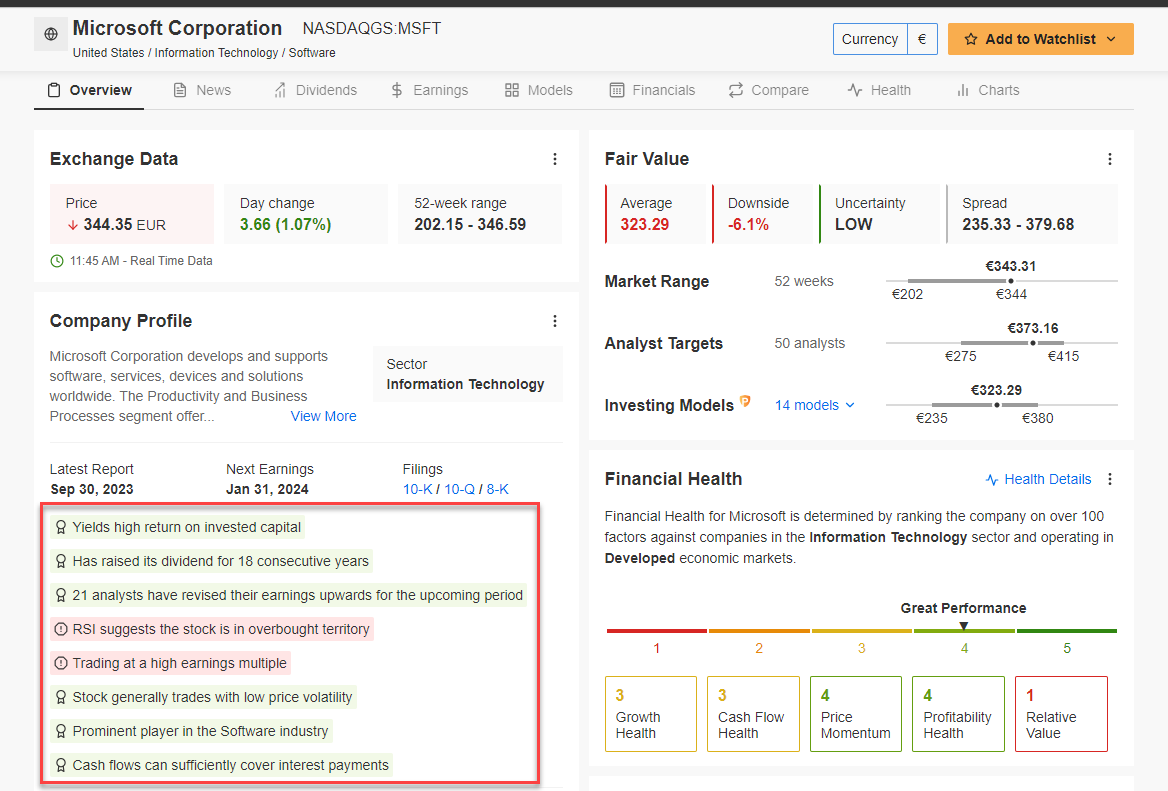
- InvestingPro 's ProTips feature provides summarized and prioritized information on the most relevant aspects of company performance, including risks, rewards, and importance.
- Find out which stocks are trading at a discount this Black Friday with our exclusive InvestingPro offer.
Navigating the stock market can seem daunting, especially with the sea of financial data available. However, a basic understanding can transform this complexity into valuable insights and enhance your investment strategy.
It's crucial to recognize that these financial figures essentially reflect a company's financial health, addressing fundamental questions like revenue growth, expense management, and debt levels.
Unraveling the answers to these questions often involves deciphering documents like the balance sheet, income statement, or cash flow statement—documents that can be challenging for the average investor.
Enter InvestingPro, an investment platform that simplifies intricate data, including EBITDA, ROE, ROI, Debt/Equity ratio, and more.
This platform offers automated and visual analyses of these complex documents, providing a quick snapshot of a company's financial health and potential.
InvestingPro achieves this by interpreting intricate financial data and presenting it in user-friendly graphs and statistics.
A recent addition to its features, ProTips, aims to assist all types of investors, whether you're a beginner or an expert.
This easy-to-use tool provides summarized and prioritized information, ranks insights, educates on financial concepts, and offers meticulously tested and highly prioritized metrics.
Where can I find the ProTips on Investing.com?
Step 1: Open the application or the website and navigate to the security or instrument you are interested in.
Step 2: Look for the ProTips section, in the app you will find it under Key Statistics and on the InvestingPro website under Company Profile. This new tool will show you summarized and prioritized information. 
Source: InvestingPro
Step 3: On the web, click on each tip to understand its meaning and view contextual information, including backtesting and peer benchmarks.

Source: InvestingPro
Having the best market information that can affect our portfolio is critical. Try all the possibilities InvestingPro has to offer now.
***
Buy or Sell? Get the answer with InvestingPro for Half of the Price This Black Friday!
Timely insights and informed decisions are the keys to maximizing profit potential. This Black Friday, make the smartest investment decision in the market and save up to 55% on InvestingPro subscription plans.
Whether you're a seasoned trader or just starting your investment journey, this offer is designed to equip you with the wisdom needed for more intelligent and profitable trading.
Disclaimer: This article is written for informational purposes only; it does not constitute a solicitation, offer, advice or recommendation to invest as such and is in no way intended to encourage the purchase of assets. I would like to remind you that any asset class is evaluated from multiple points of view and is highly risky. Therefore, any investment decision and the associated risk remains with the investor.
