- Eight-year bear market
- Prices broke higher in late 2020
- Corn, soybeans, and wheat prices soar to over six-year highs
- All about the weather
- Grains will remain strong
- The falling US dollar is bullish for all commodity prices. The dollar index settled at the 90.068 level on Jan. 8, within striking distance of critical technical support at the February 2018, 88.15 low. Since the dollar is the world’s reserve currency, it is the pricing mechanism for grain, agricultural, and all other raw material prices.
- China is the world’s most populous and second wealthiest nation. Before the trade war over the past years, the Chinese typically purchased one-quarter of the US soybean crop and many other agricultural products from the US and producing nations worldwide. China has been buying soybeans over the past months as they rebuild their hog population. Soybean meal, an oilseed product, is the primary ingredient in animal feed. Moreover, the incoming Biden administration is likely to reduce trade tensions, leading to even more demand for US agricultural products from the Chinese.
- Finally, demographics always underpin the commodities that feed the world. In Q4, the world added approximately twenty million mouths to feed. In 2020, more people required nutrition than in 2019, and in 2021 there will be even more food product consumers. Production must keep pace with the ever-increasing addressable market to meet requirements. Any bump in the road when it comes to output will push prices even higher.
Corn and soybeans reached an all-time high in 2012. Drought across the fertile plains of the US pushed soybeans to a peak of $17.9475. Corn rose to its record high of $8.4375 per bushel. The grain and oilseed then made lower highs and lows and remained in a bear market for eight years, until 2020. The US is the world’s leading producer and exporter of the coarse grain and oilseed.
Meanwhile, the United States is a leading wheat producer and exporter, but the production of the primary ingredient in bread is a worldwide affair. Wheat rose to its record high in 2008 when the price reached $13.3450. In 2012, CBOT wheat futures traded to a lower high of $9.4725 when corn and beans rose to record levels.
After eight years of bear market conditions, the three leading grain futures markets came back to life during the second half of 2020. As we head into 2021, the price trends in grain futures are higher. Farmers are positioned to make far more attractive returns in the 2021 crop year, which supports a range of businesses that service the agricultural community. Meanwhile, consumers will be paying more for food, and if the weather does not create bumper crops, we could see the price of the products that provide nutrition skyrocket.
Eight-year bear market
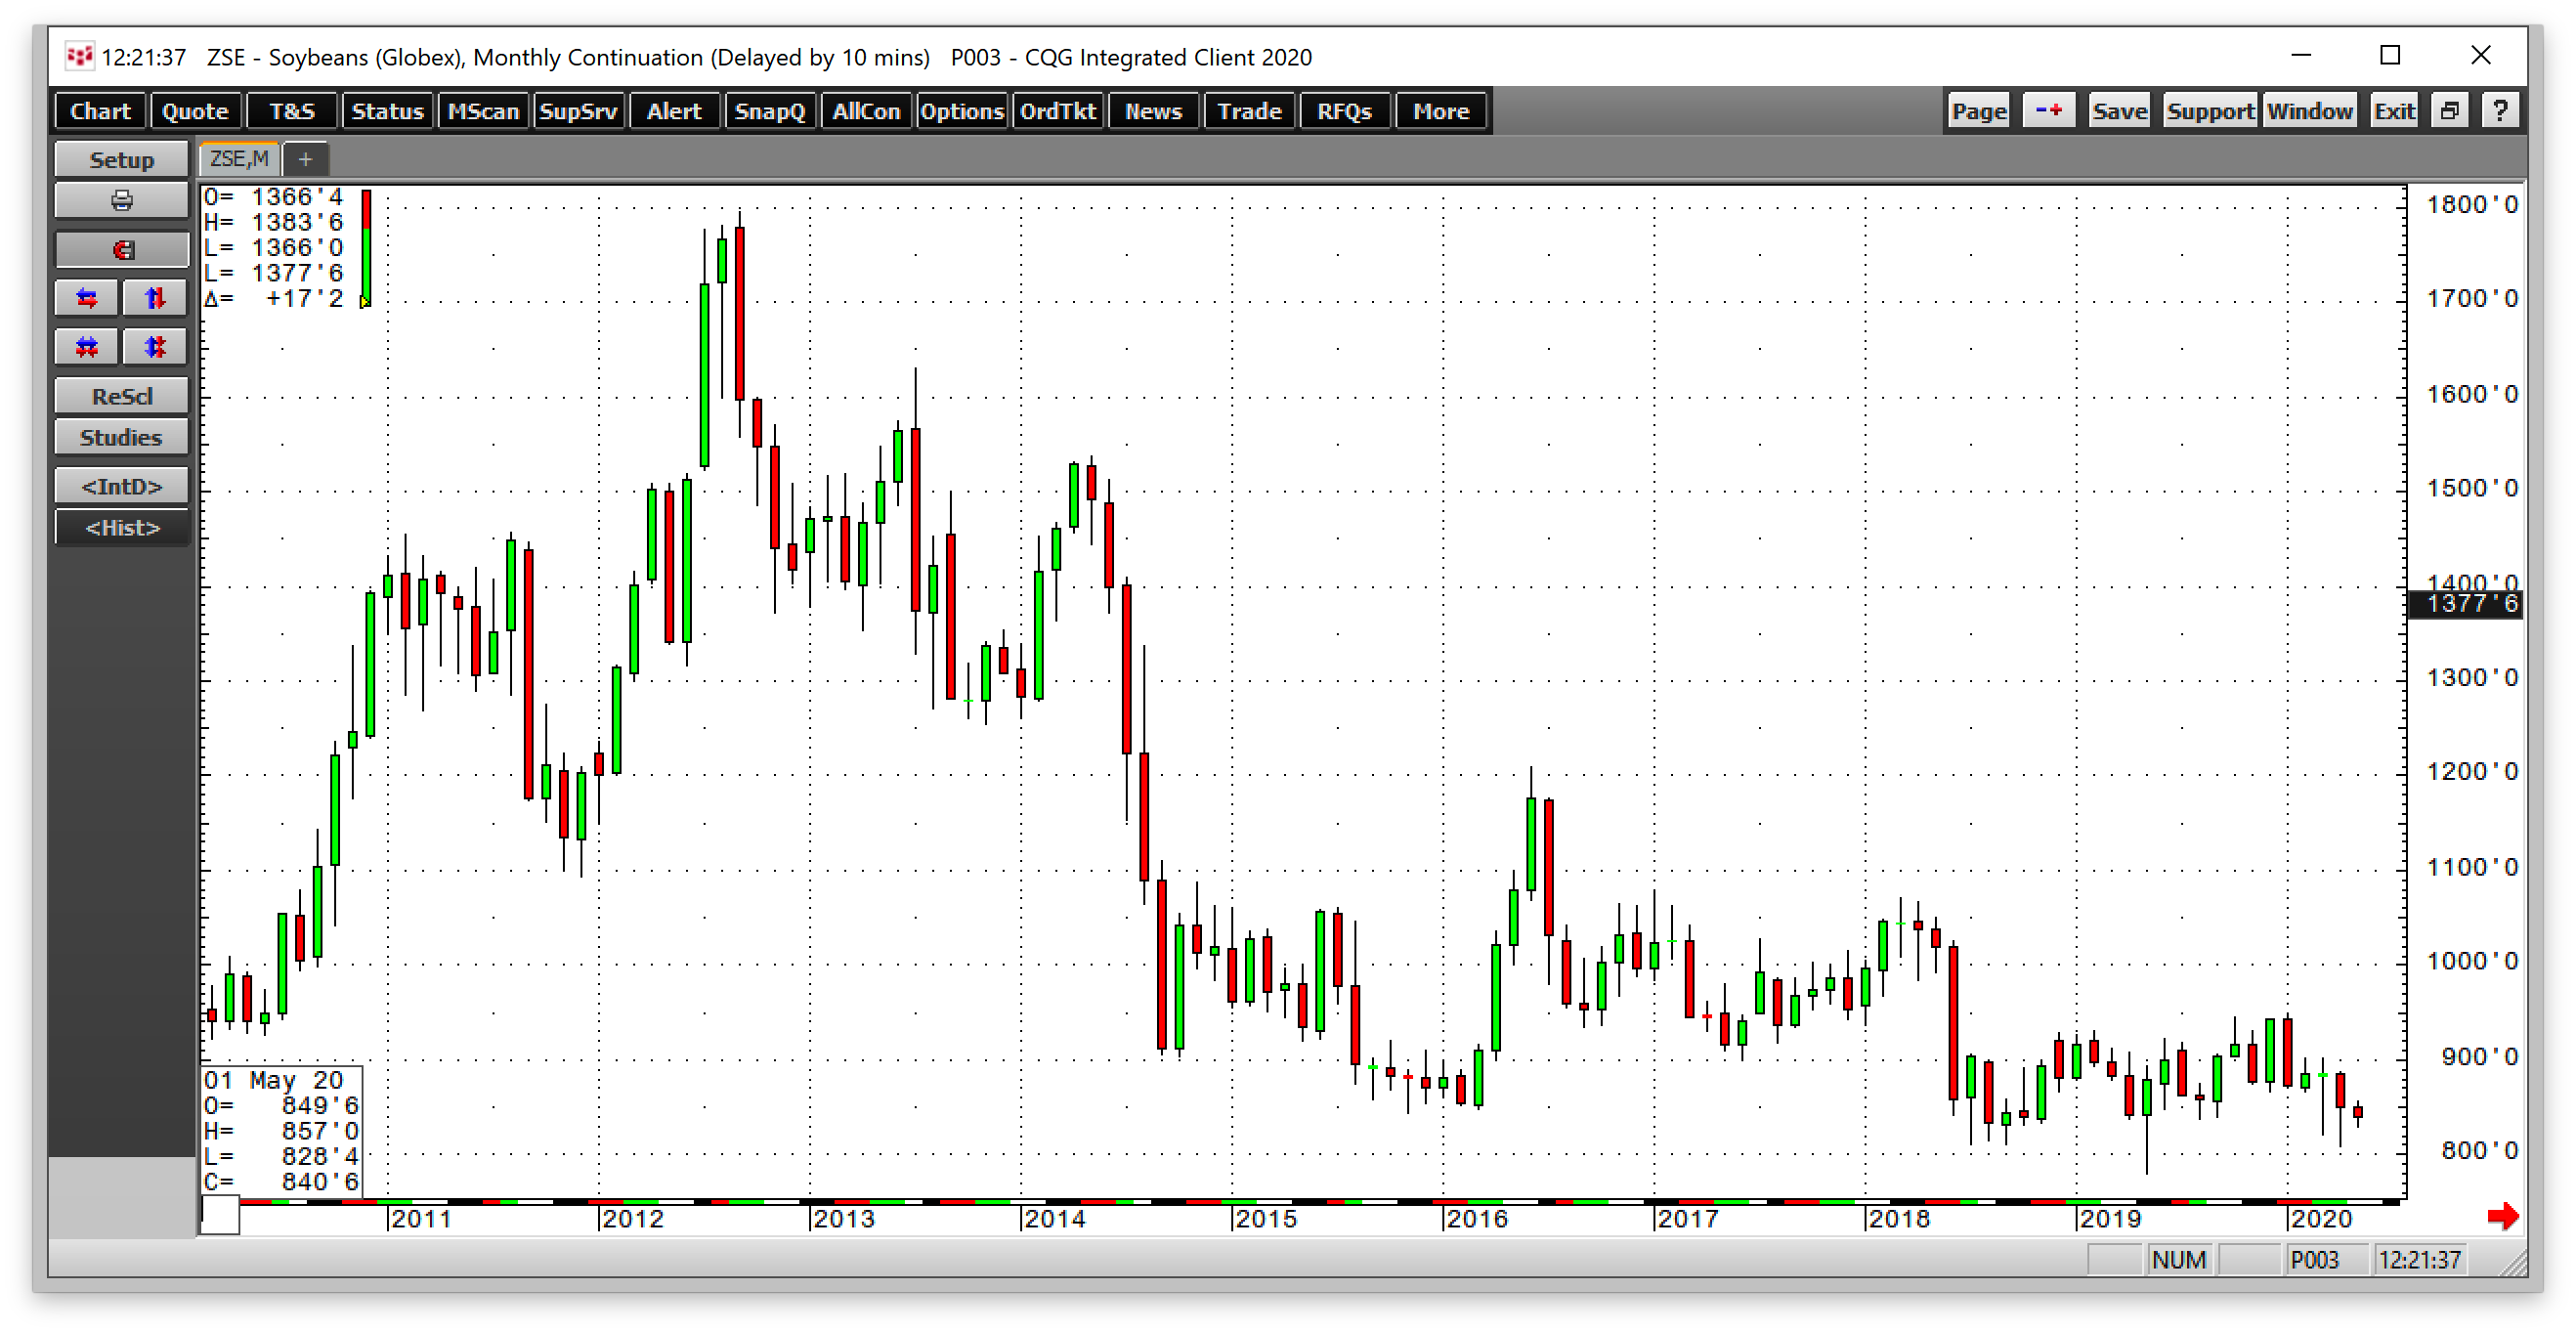
Soybean prices remained depressed after reaching a peak in September 2012 at almost $18 until May 2020 when the price was below the $8.50 per bushel level.
Source, all charts: CQG
The monthly chart shows the pattern of lower highs and lower lows for nearly eight years.
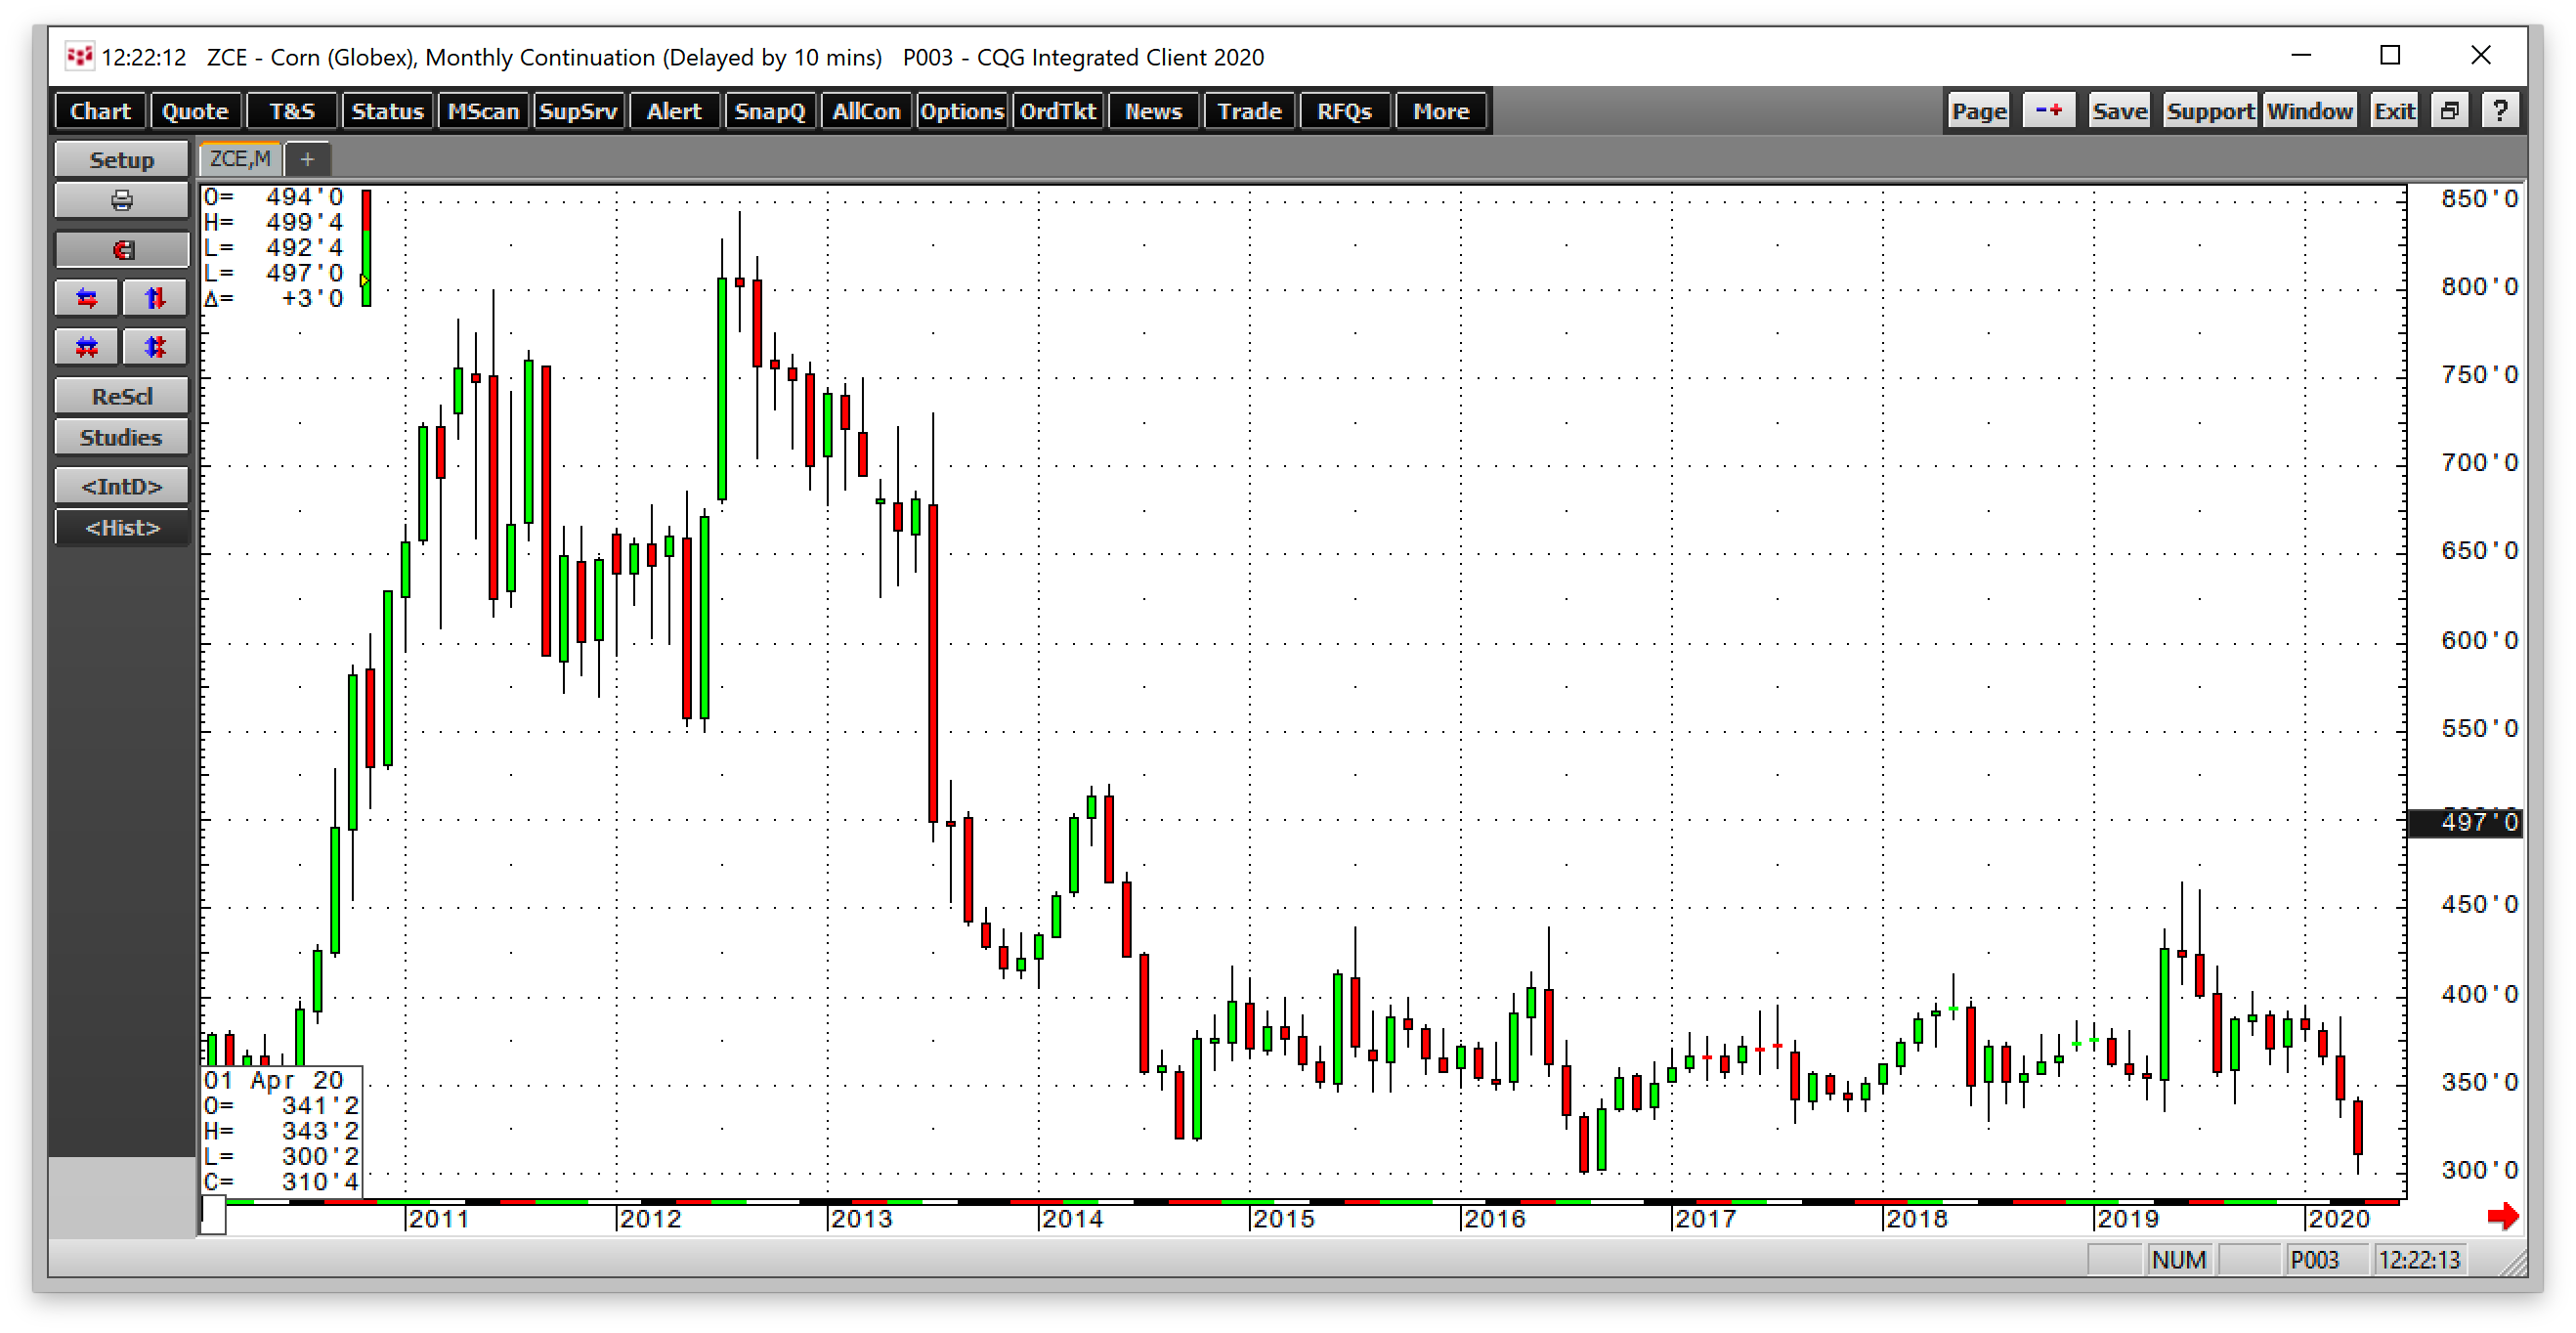
Corn fell from over $8.40 in August 2012 to a low of $3.0025 in April 2020 during the bearish multi-year period.
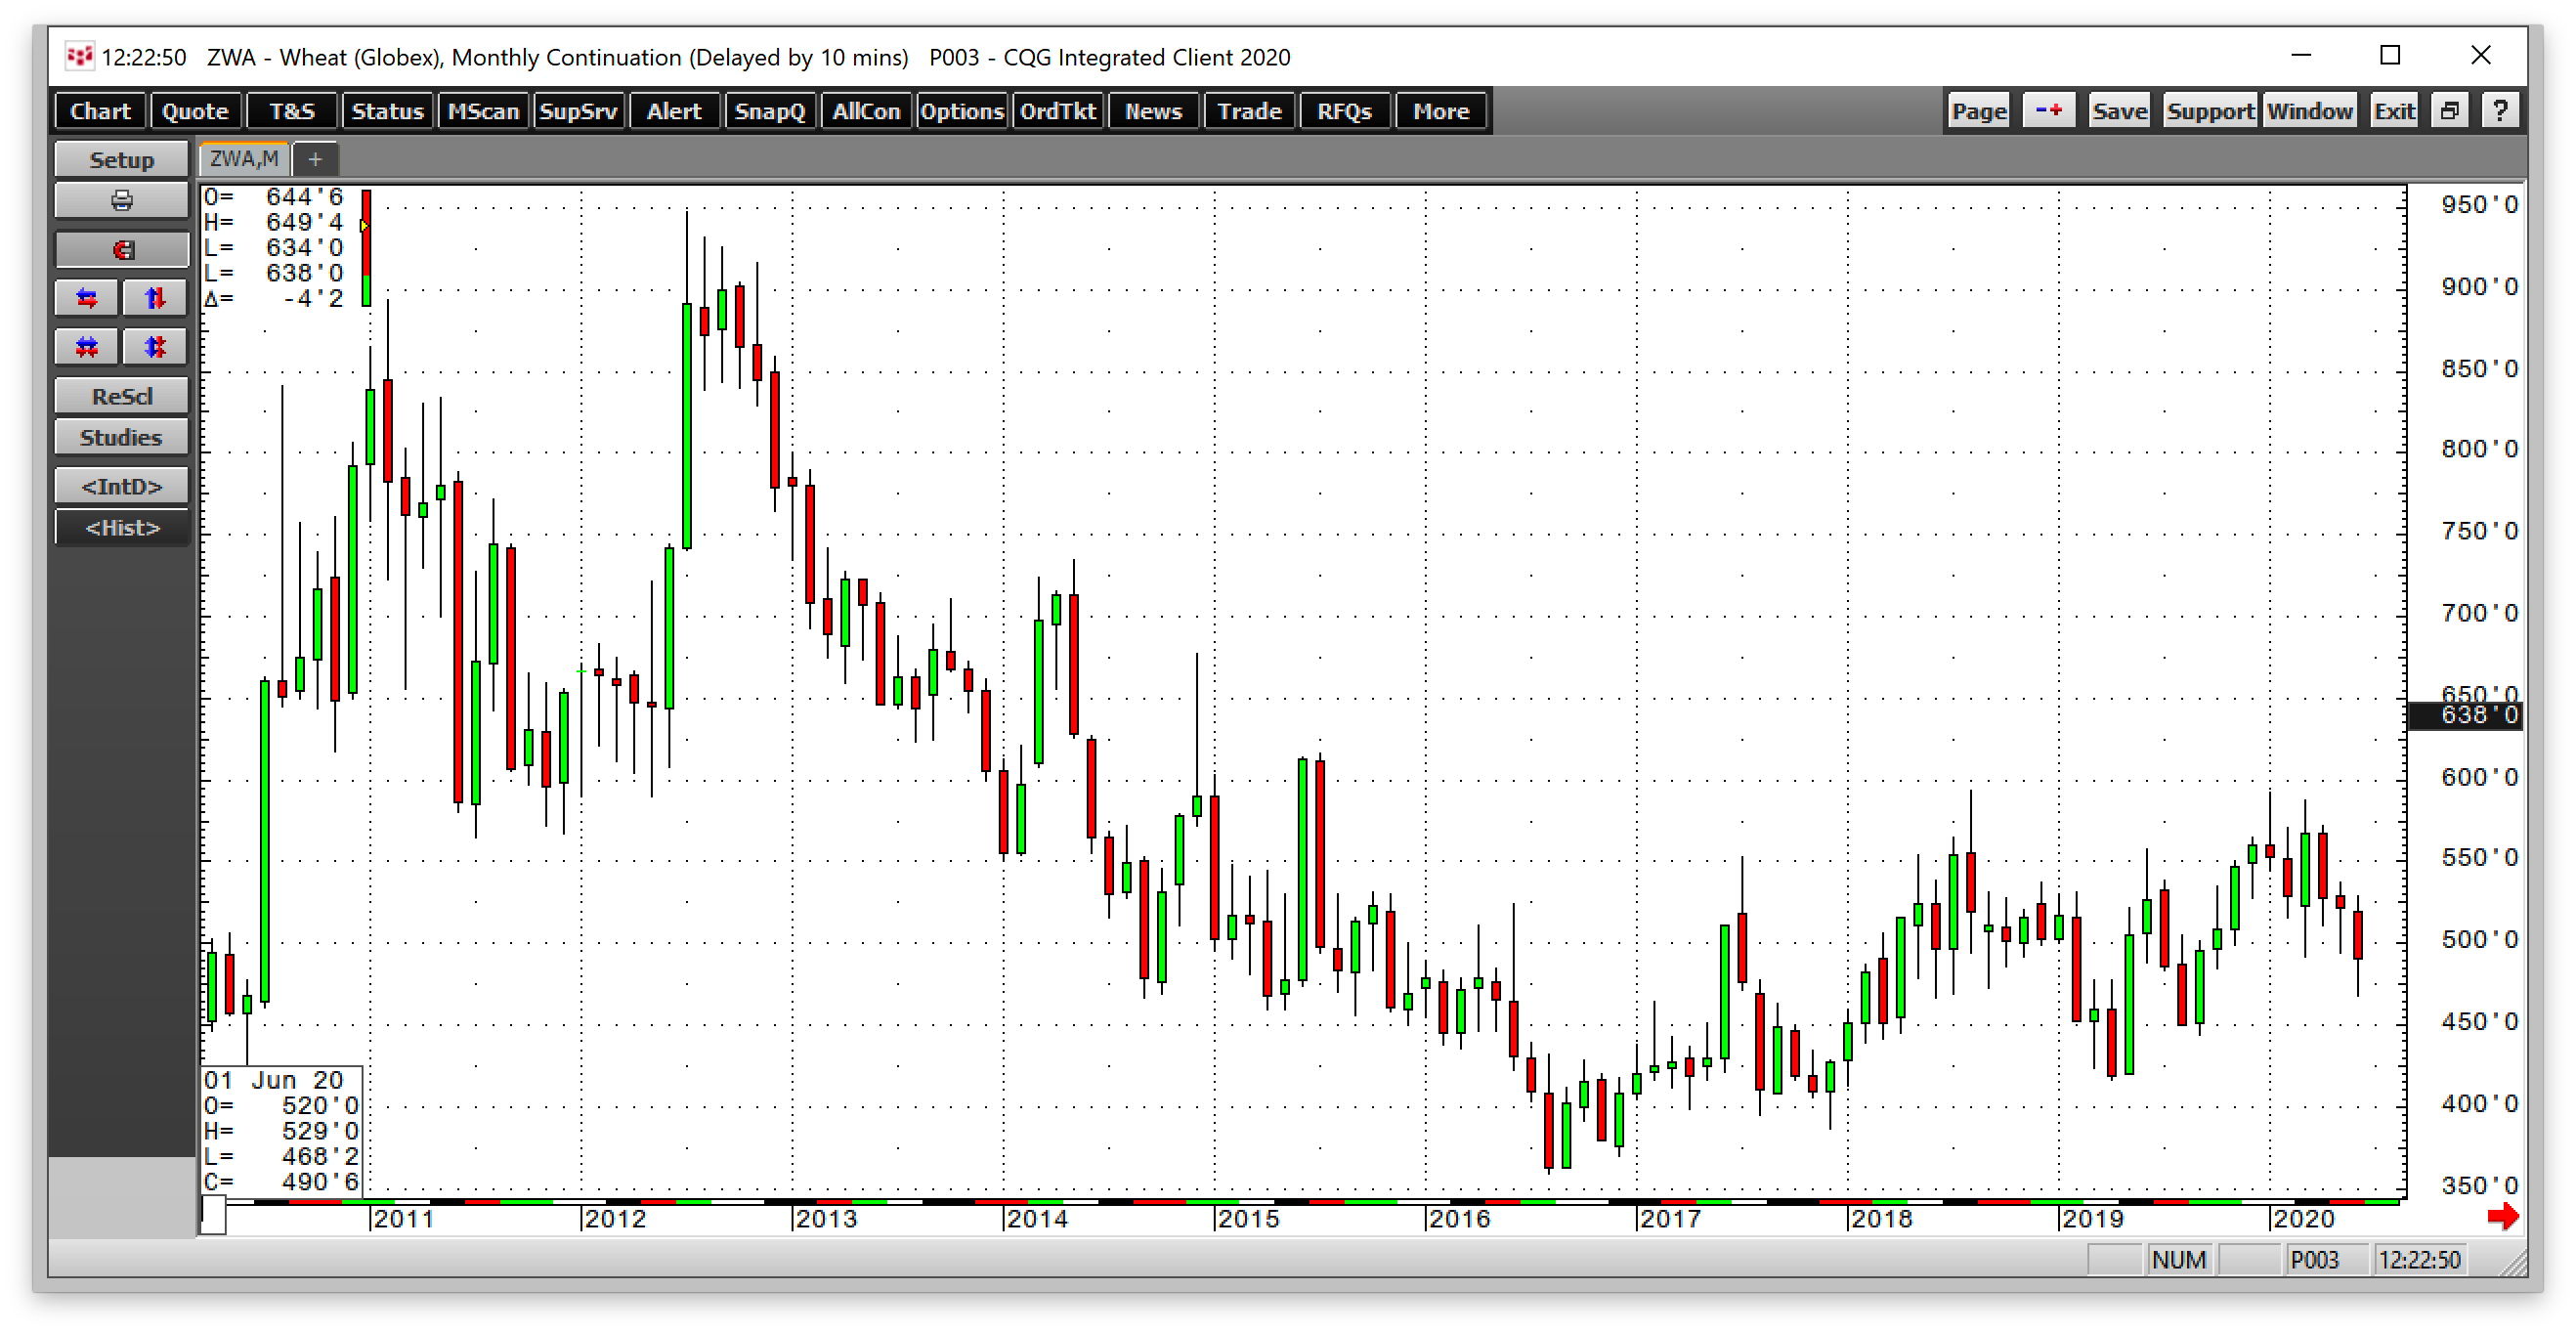
CBOT wheat futures fell from a high of $9.4725 in July 2012 to a low of $3.5950 in August 2016. While the wheat futures market made a series of higher lows and higher highs from 2016, the primary ingredient in bread reached a higher low of $4.6825 in June 2020.
The bear market in the leading grain futures markets ended during the second half of 2020.
Prices broke higher in late 2020
The weekly charts show that soybeans, corn, and CBOT wheat futures highlight the technical breaks higher over the past months.
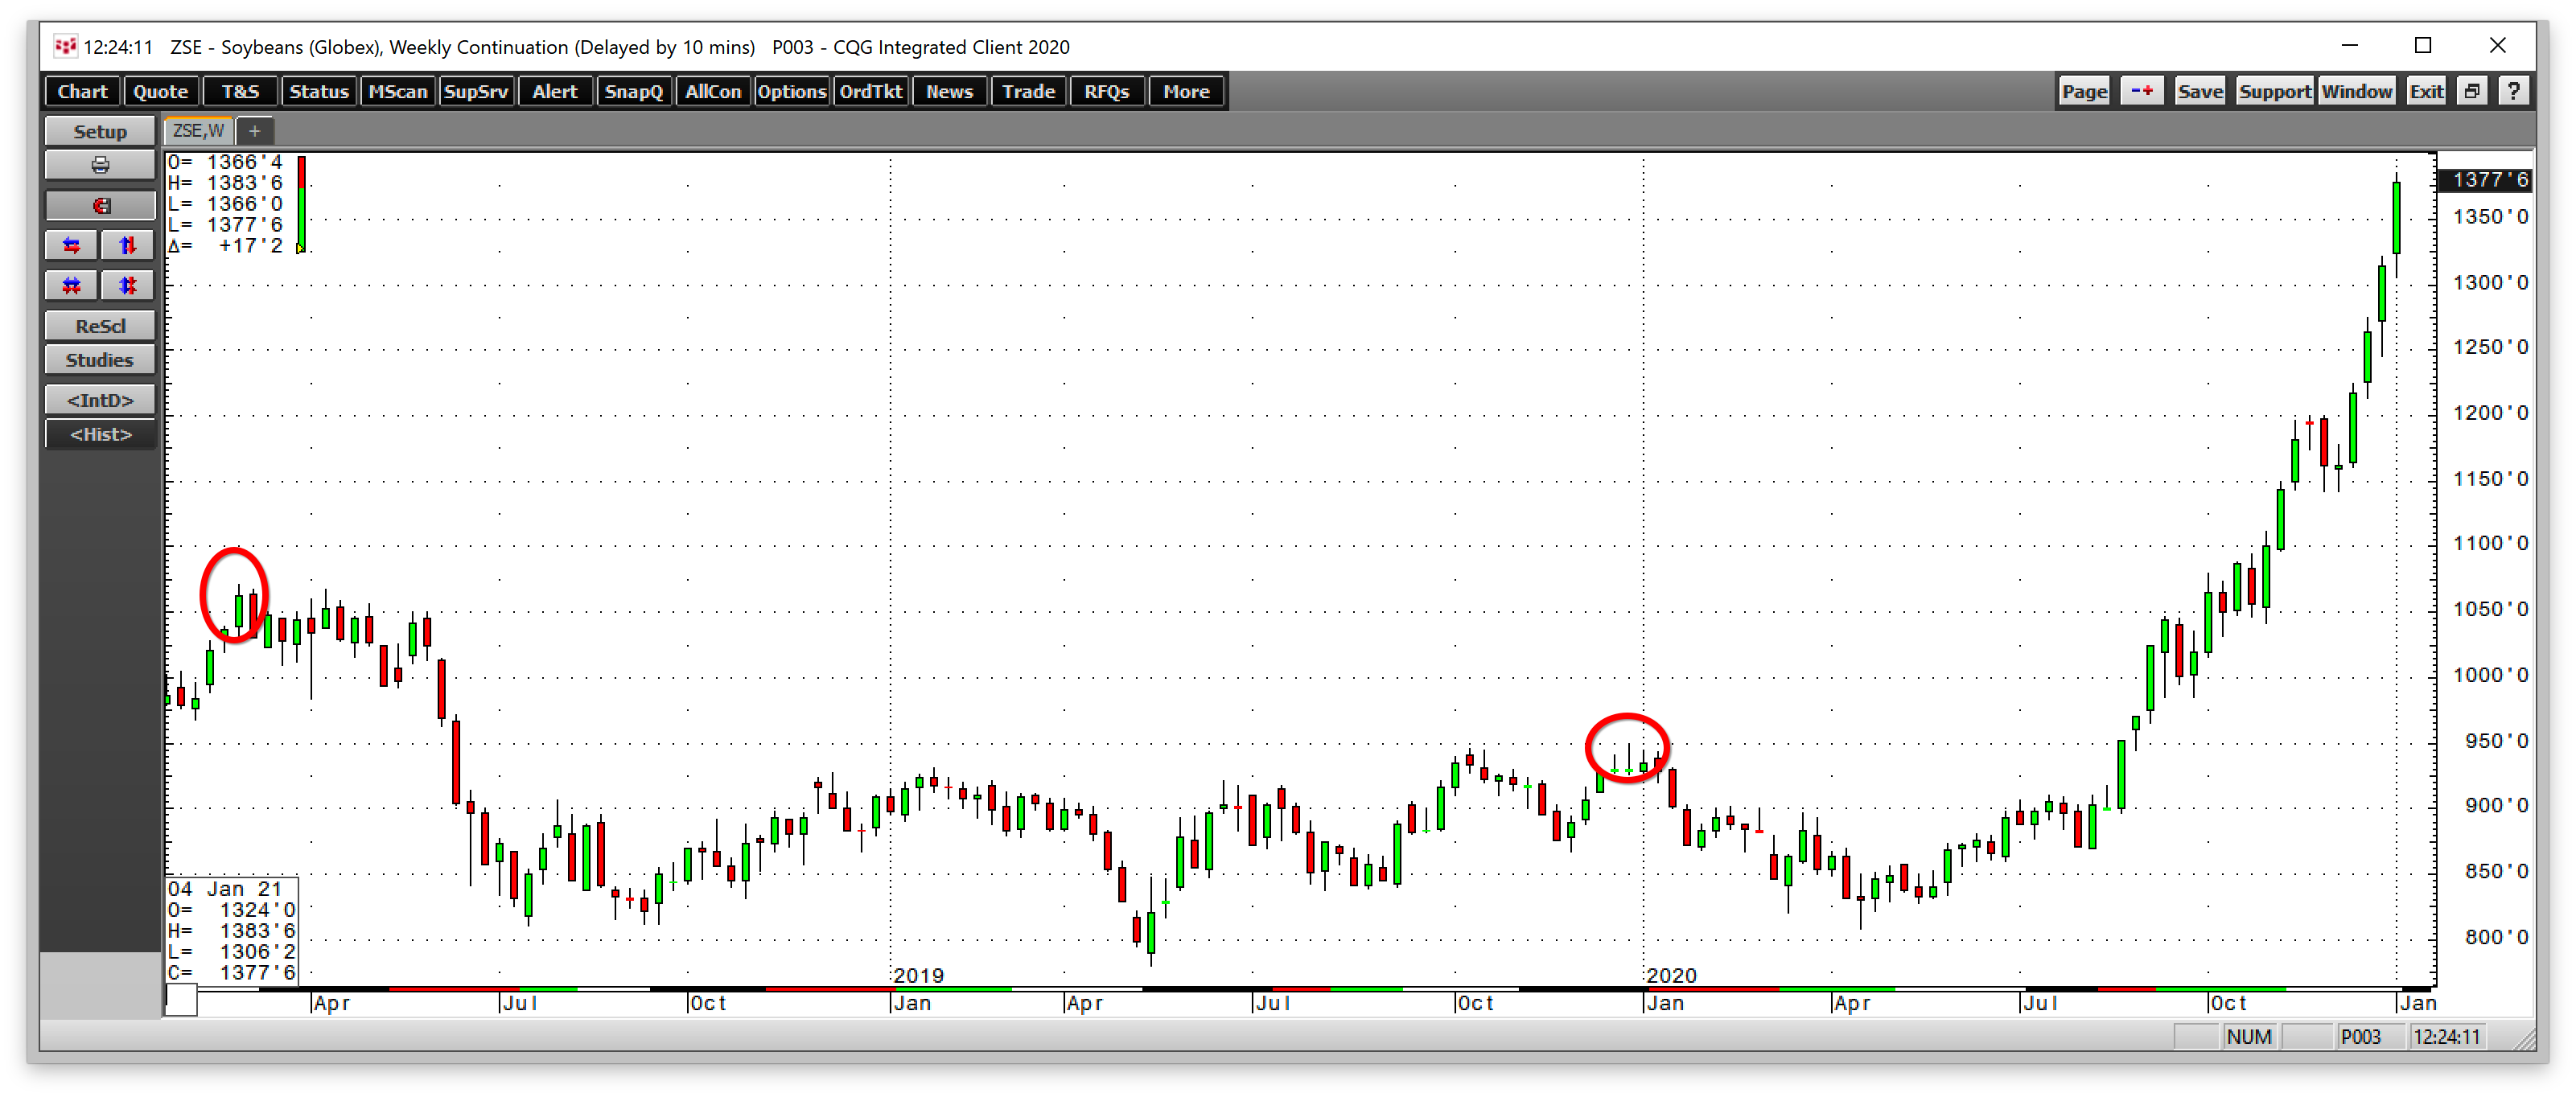
The soybean price broke above its first technical resistance level at the $9.49 high from December 2019 in late August 2020. In early October, it moved above the February 2018 $10.71 high.
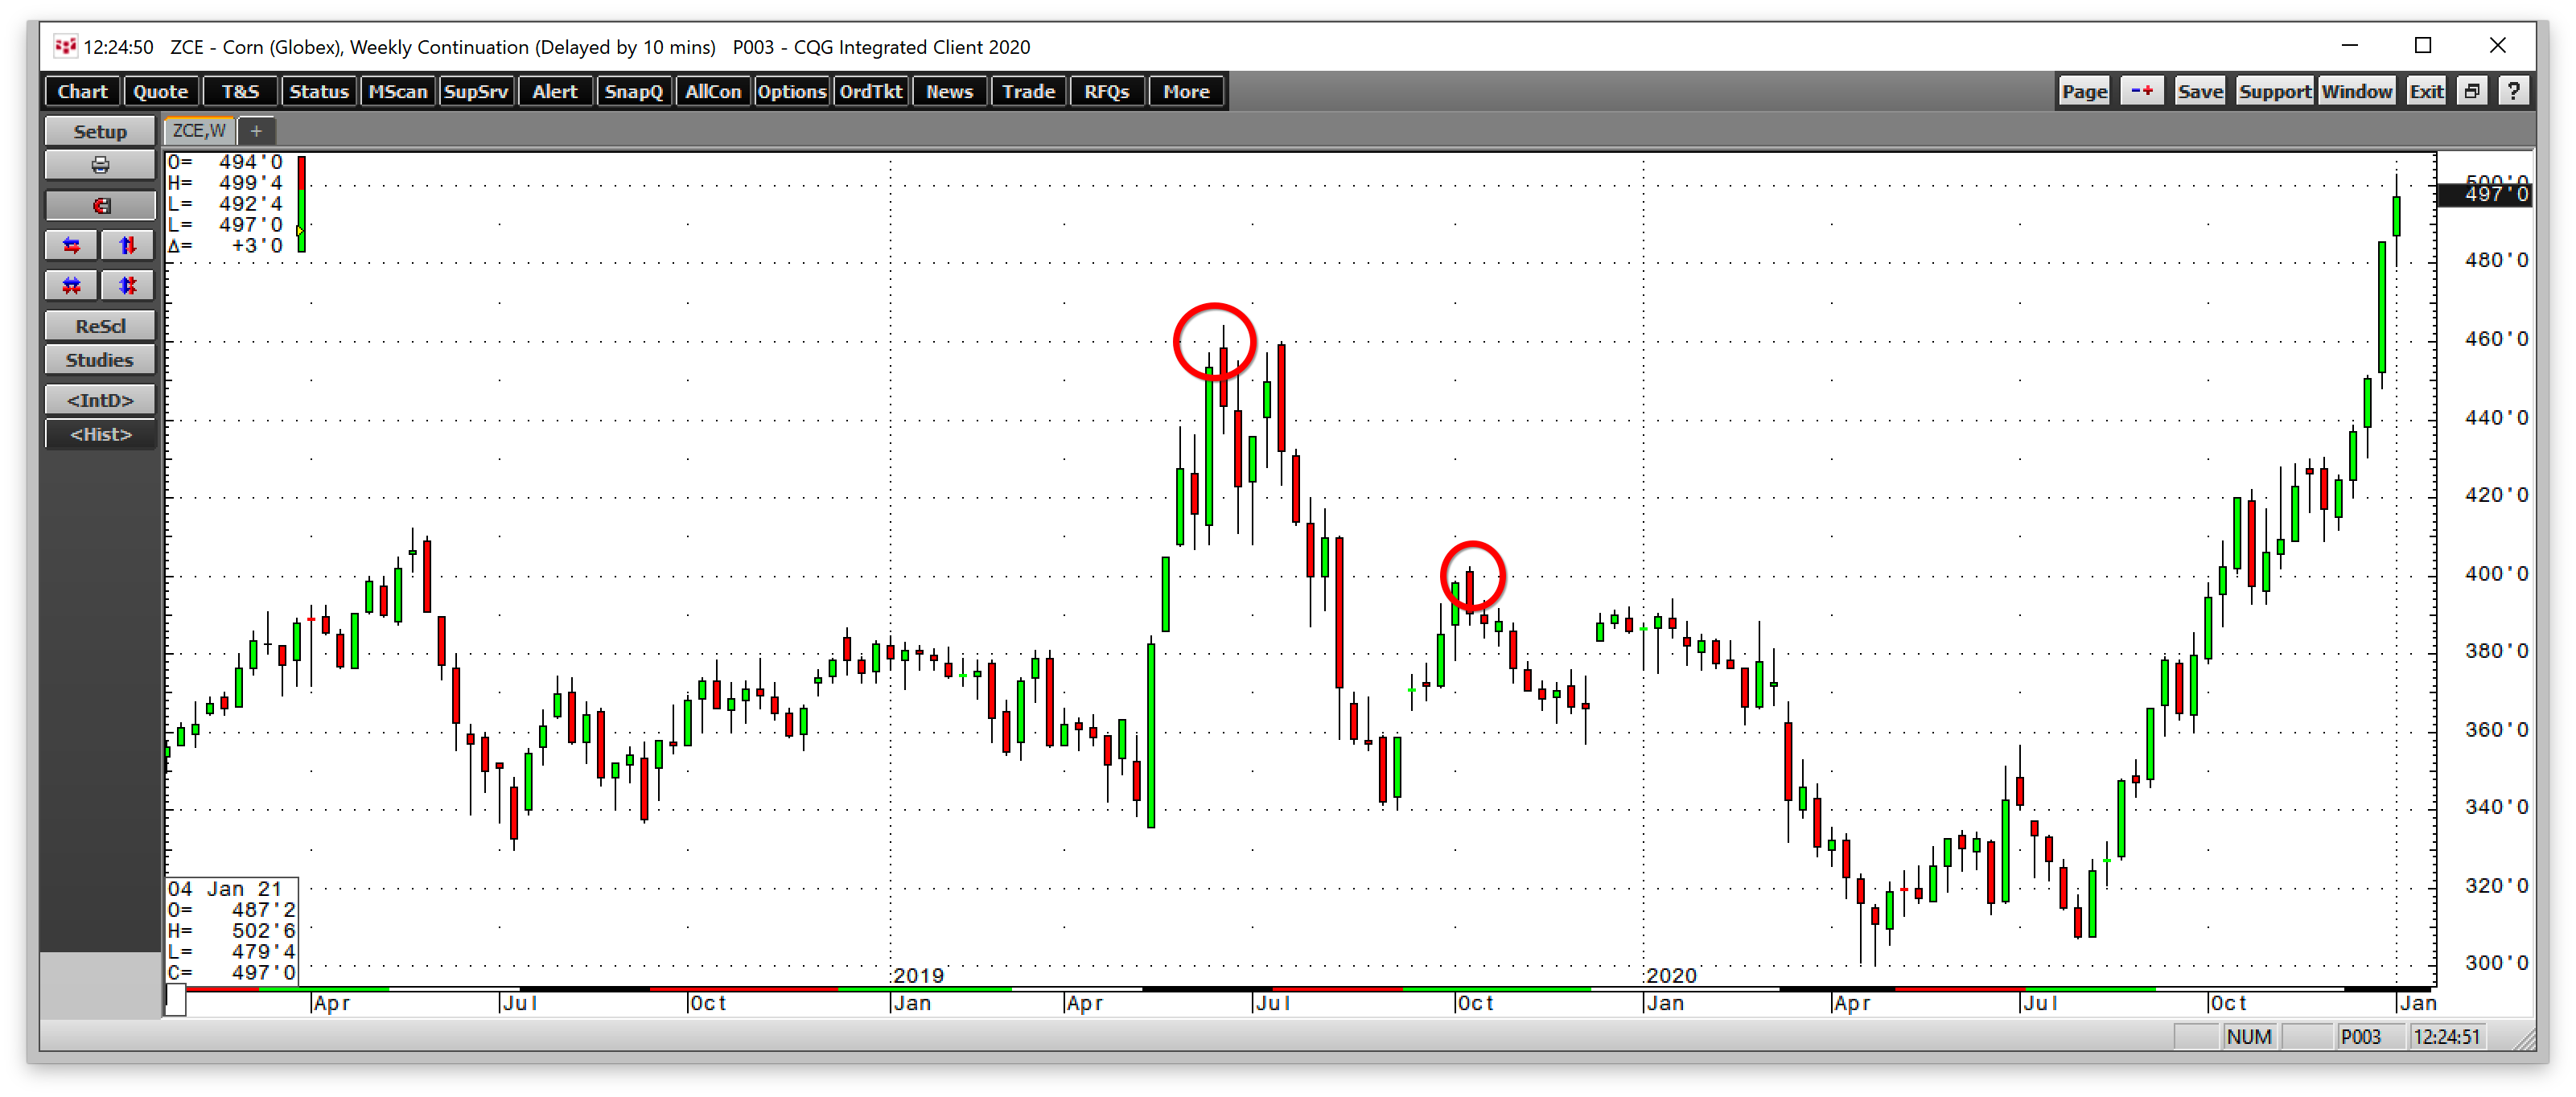
Corn futures rose above the October 2019 $4.0250 level in mid-October 2020. The corn price moved over the June 2019 $4.6425 peak during the week of Dec. 28, 2020.
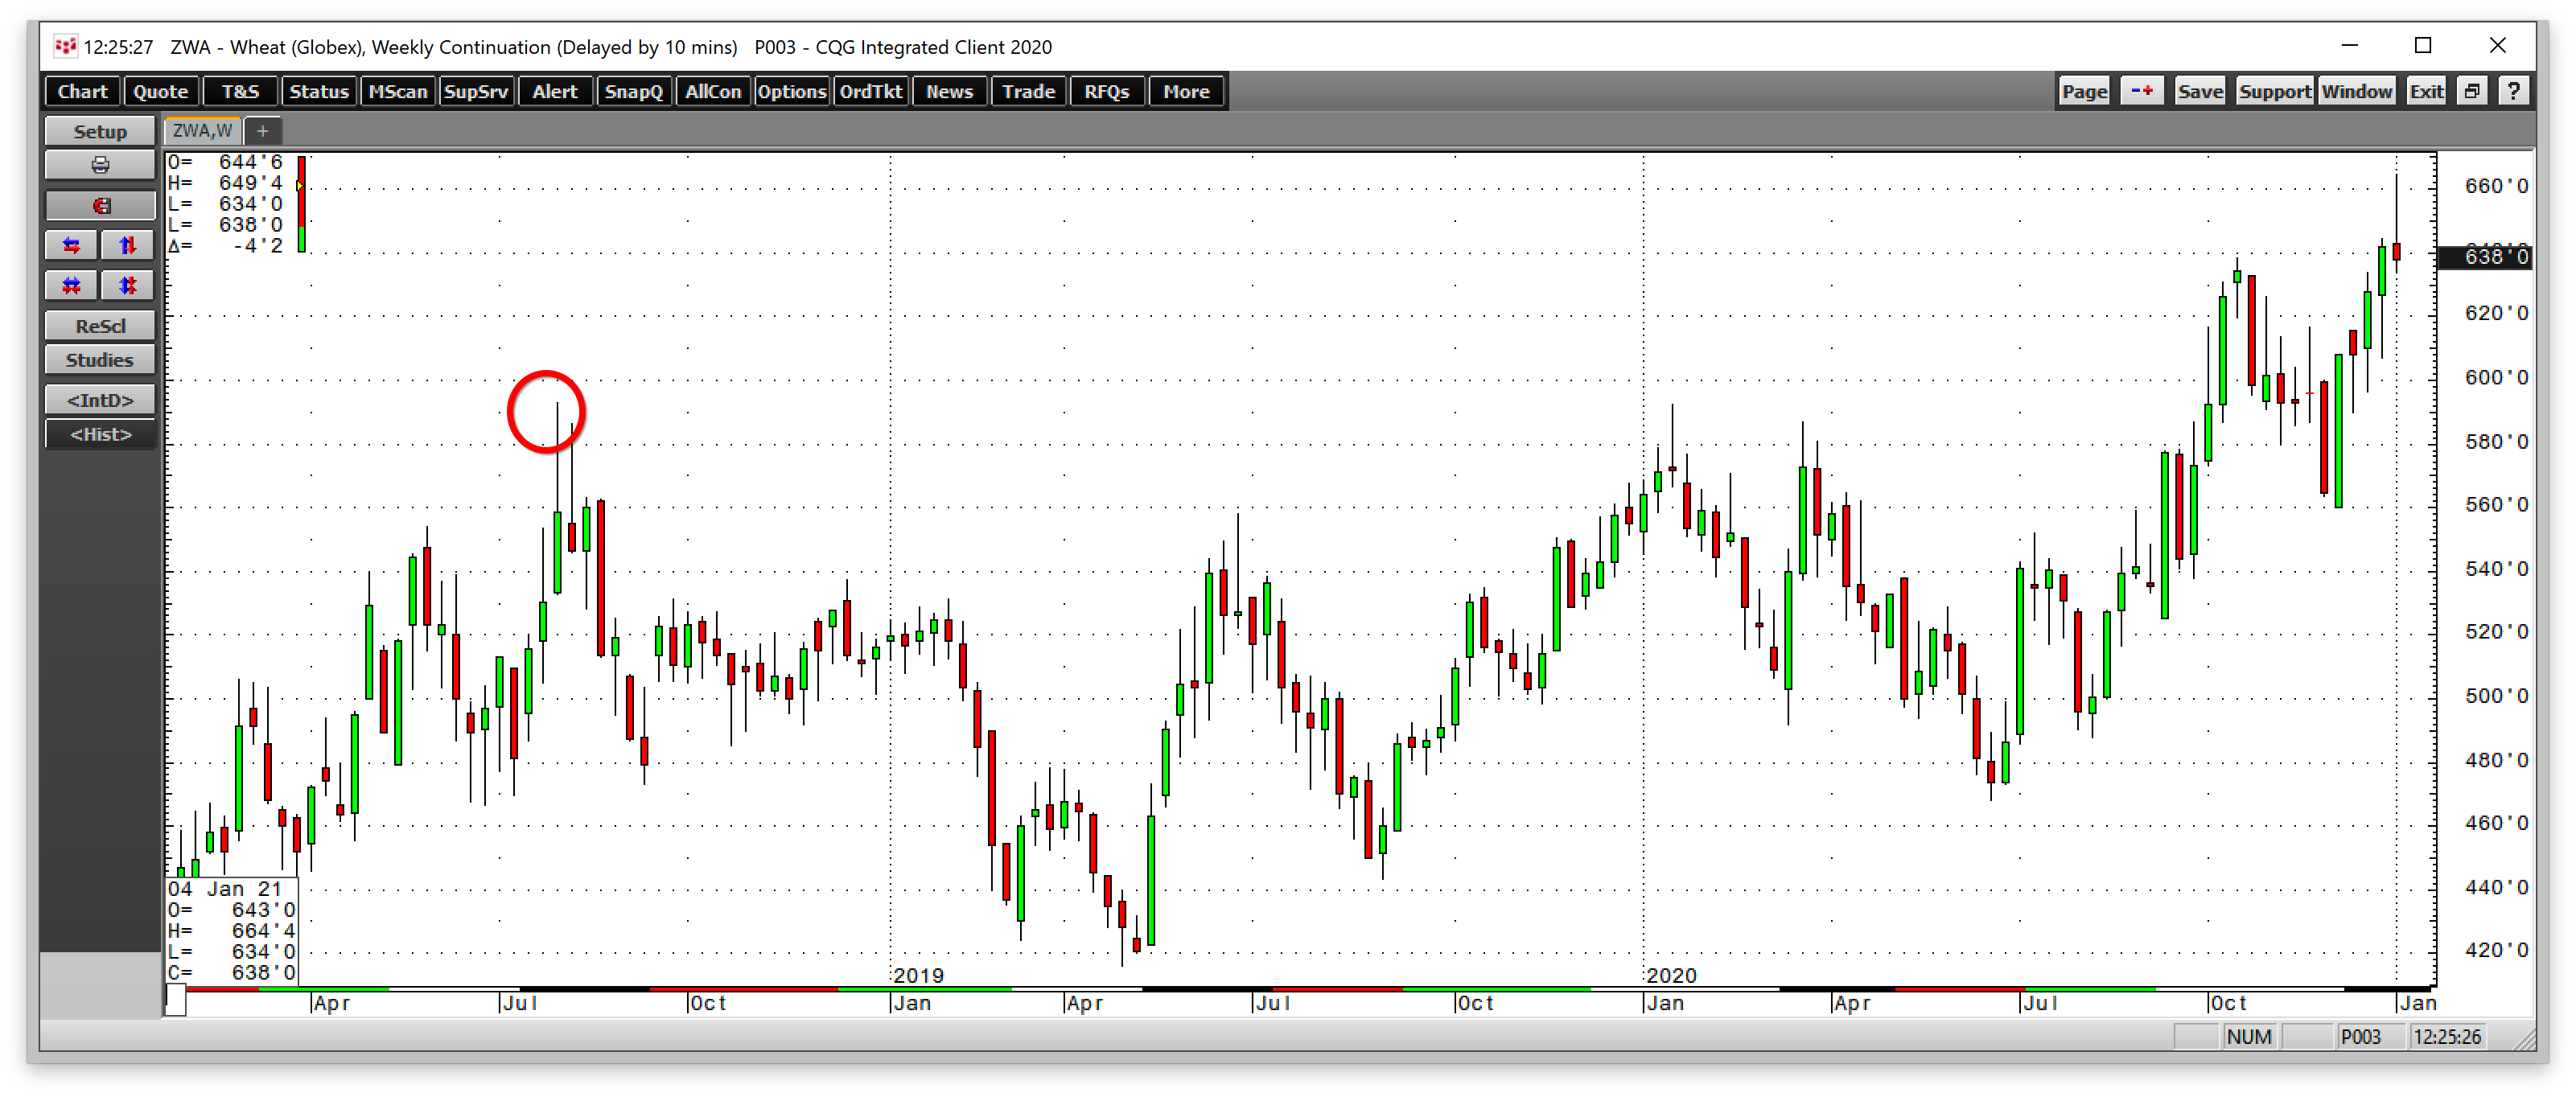
CBOT soft red winter wheat futures were the first to break out to the upside when they eclipsed the July 2018 high of $5.93 in early October 2020. The prices of the grains continued to rise after the technical moves during the second half of 2020.
Corn, soybeans, and wheat prices soar to over six-year highs
The prices of the grains were at multi-year highs at the end of the first week of 2021.
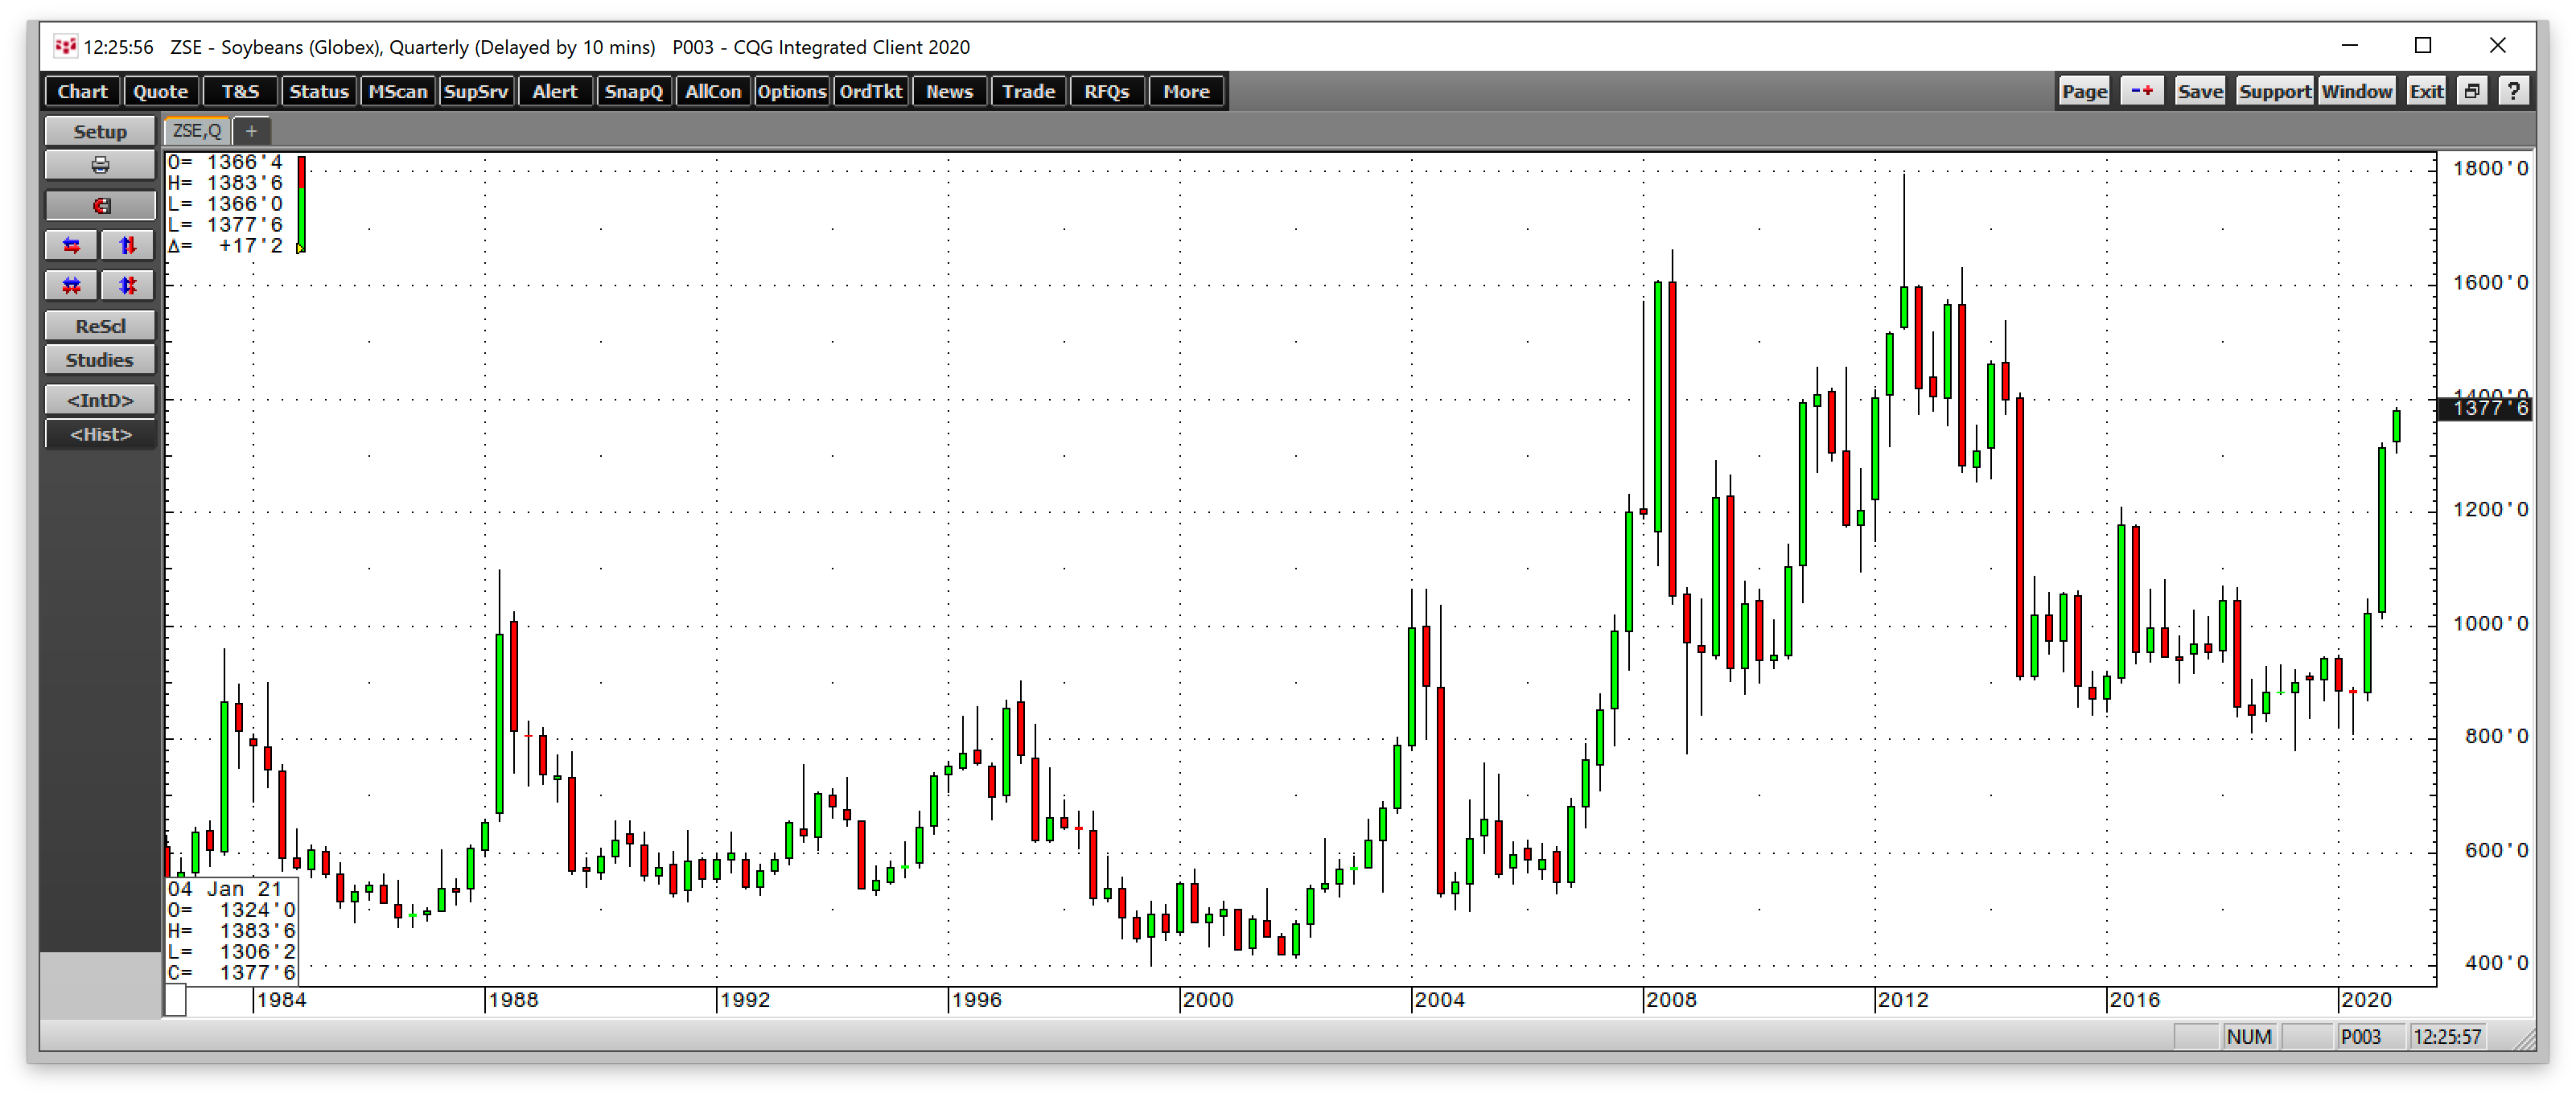
The quarterly chart illustrates the rise to a high of $13.7625 last week, with soybeans at the $13.7775 level, the highest price since July 2014.
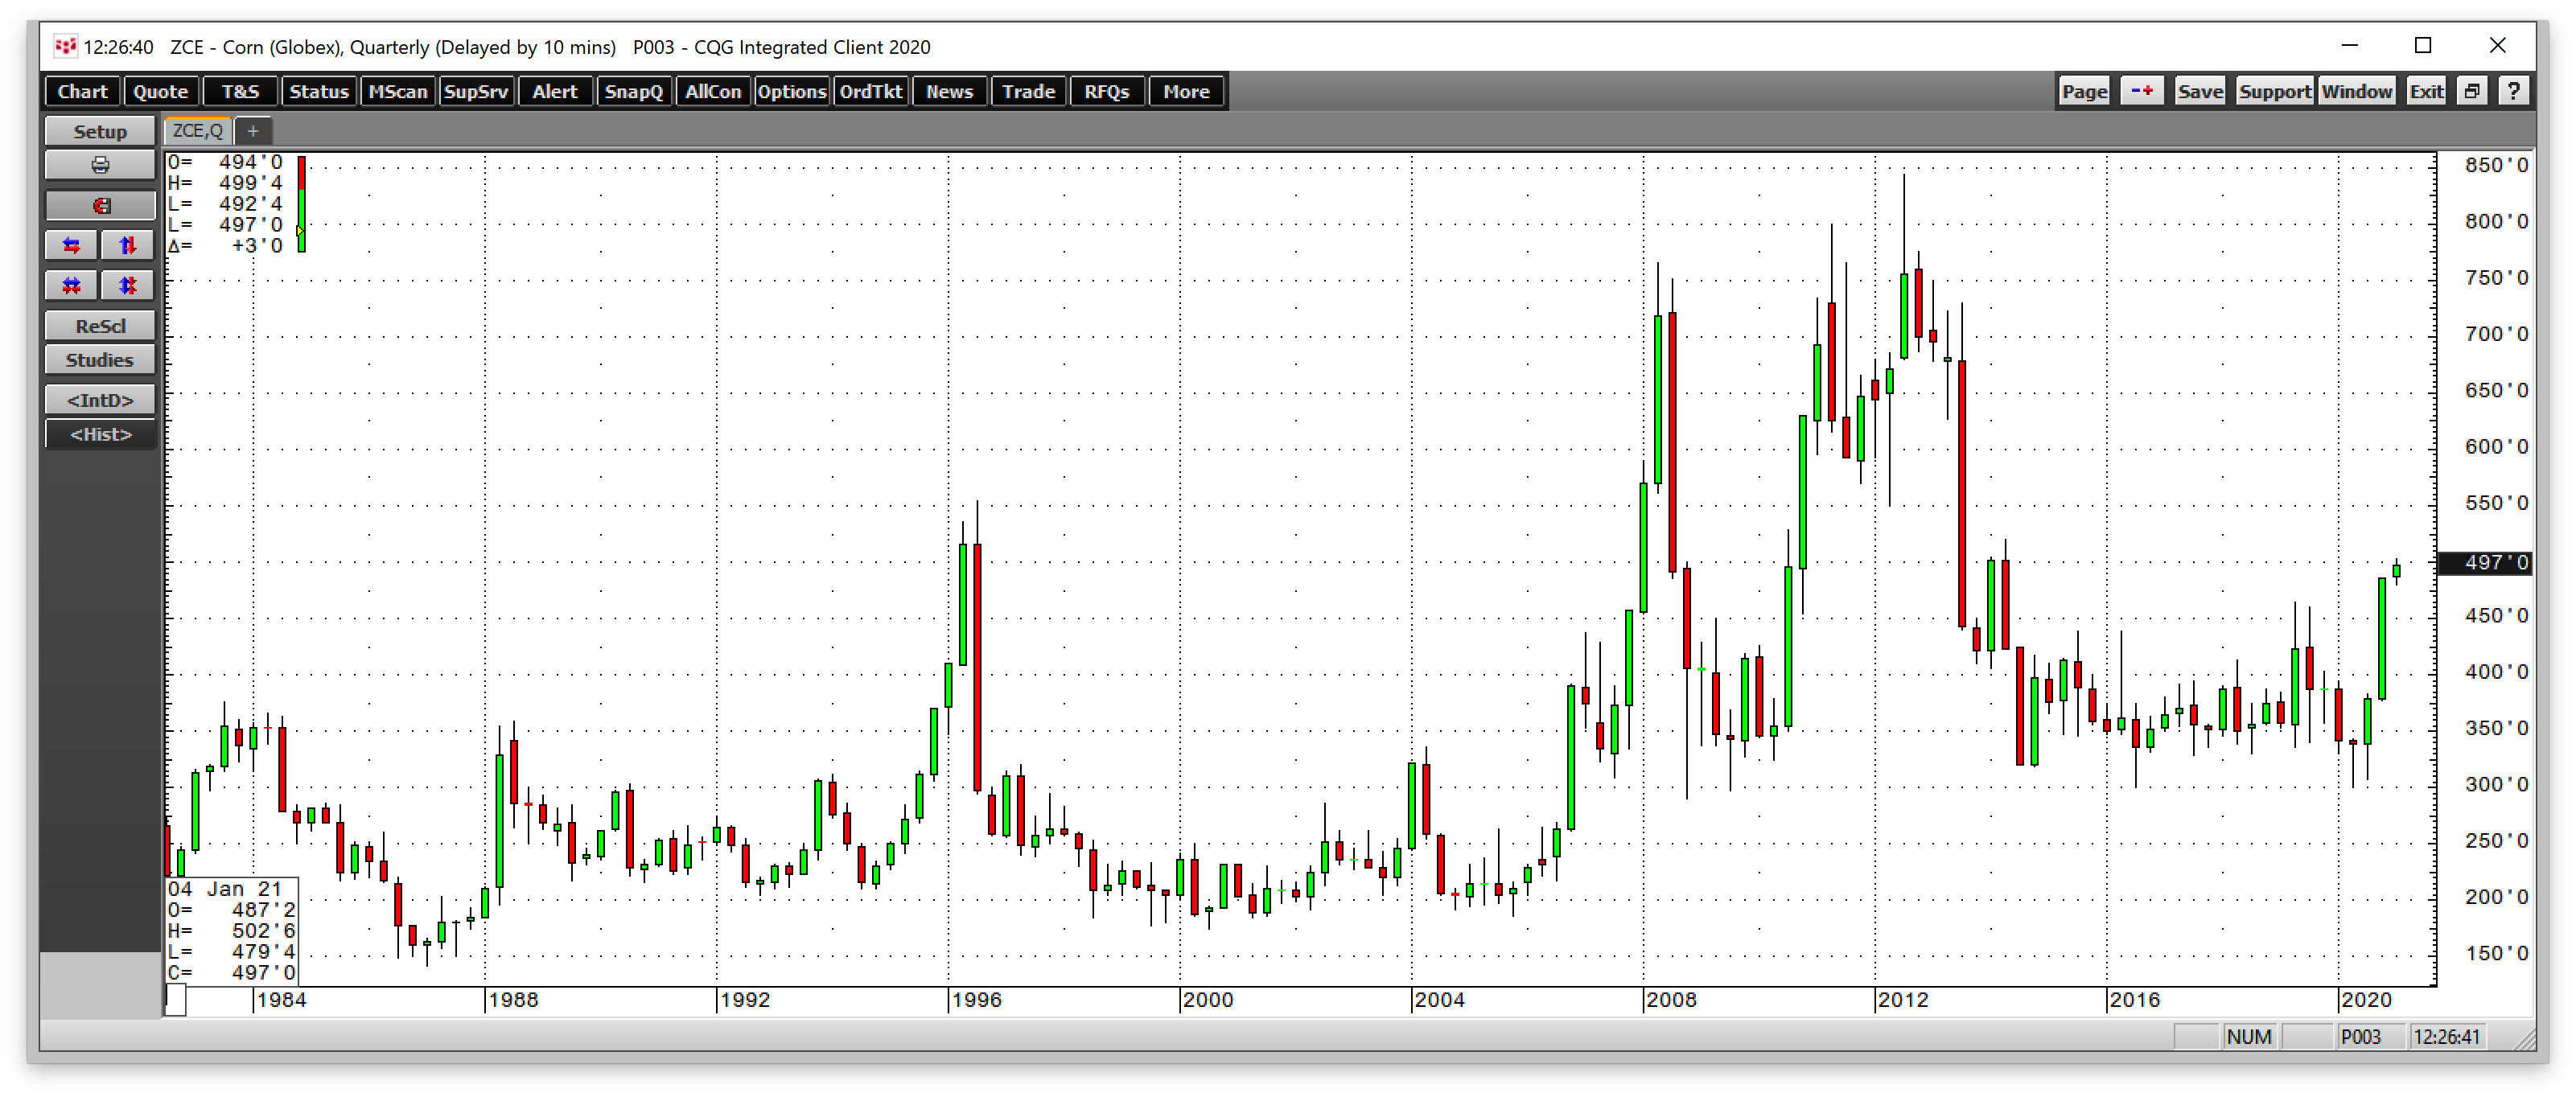
Corn traded to a high of $5.0275 last week and was at just below the $5 level on Jan. 8, the highest level since April 2014.
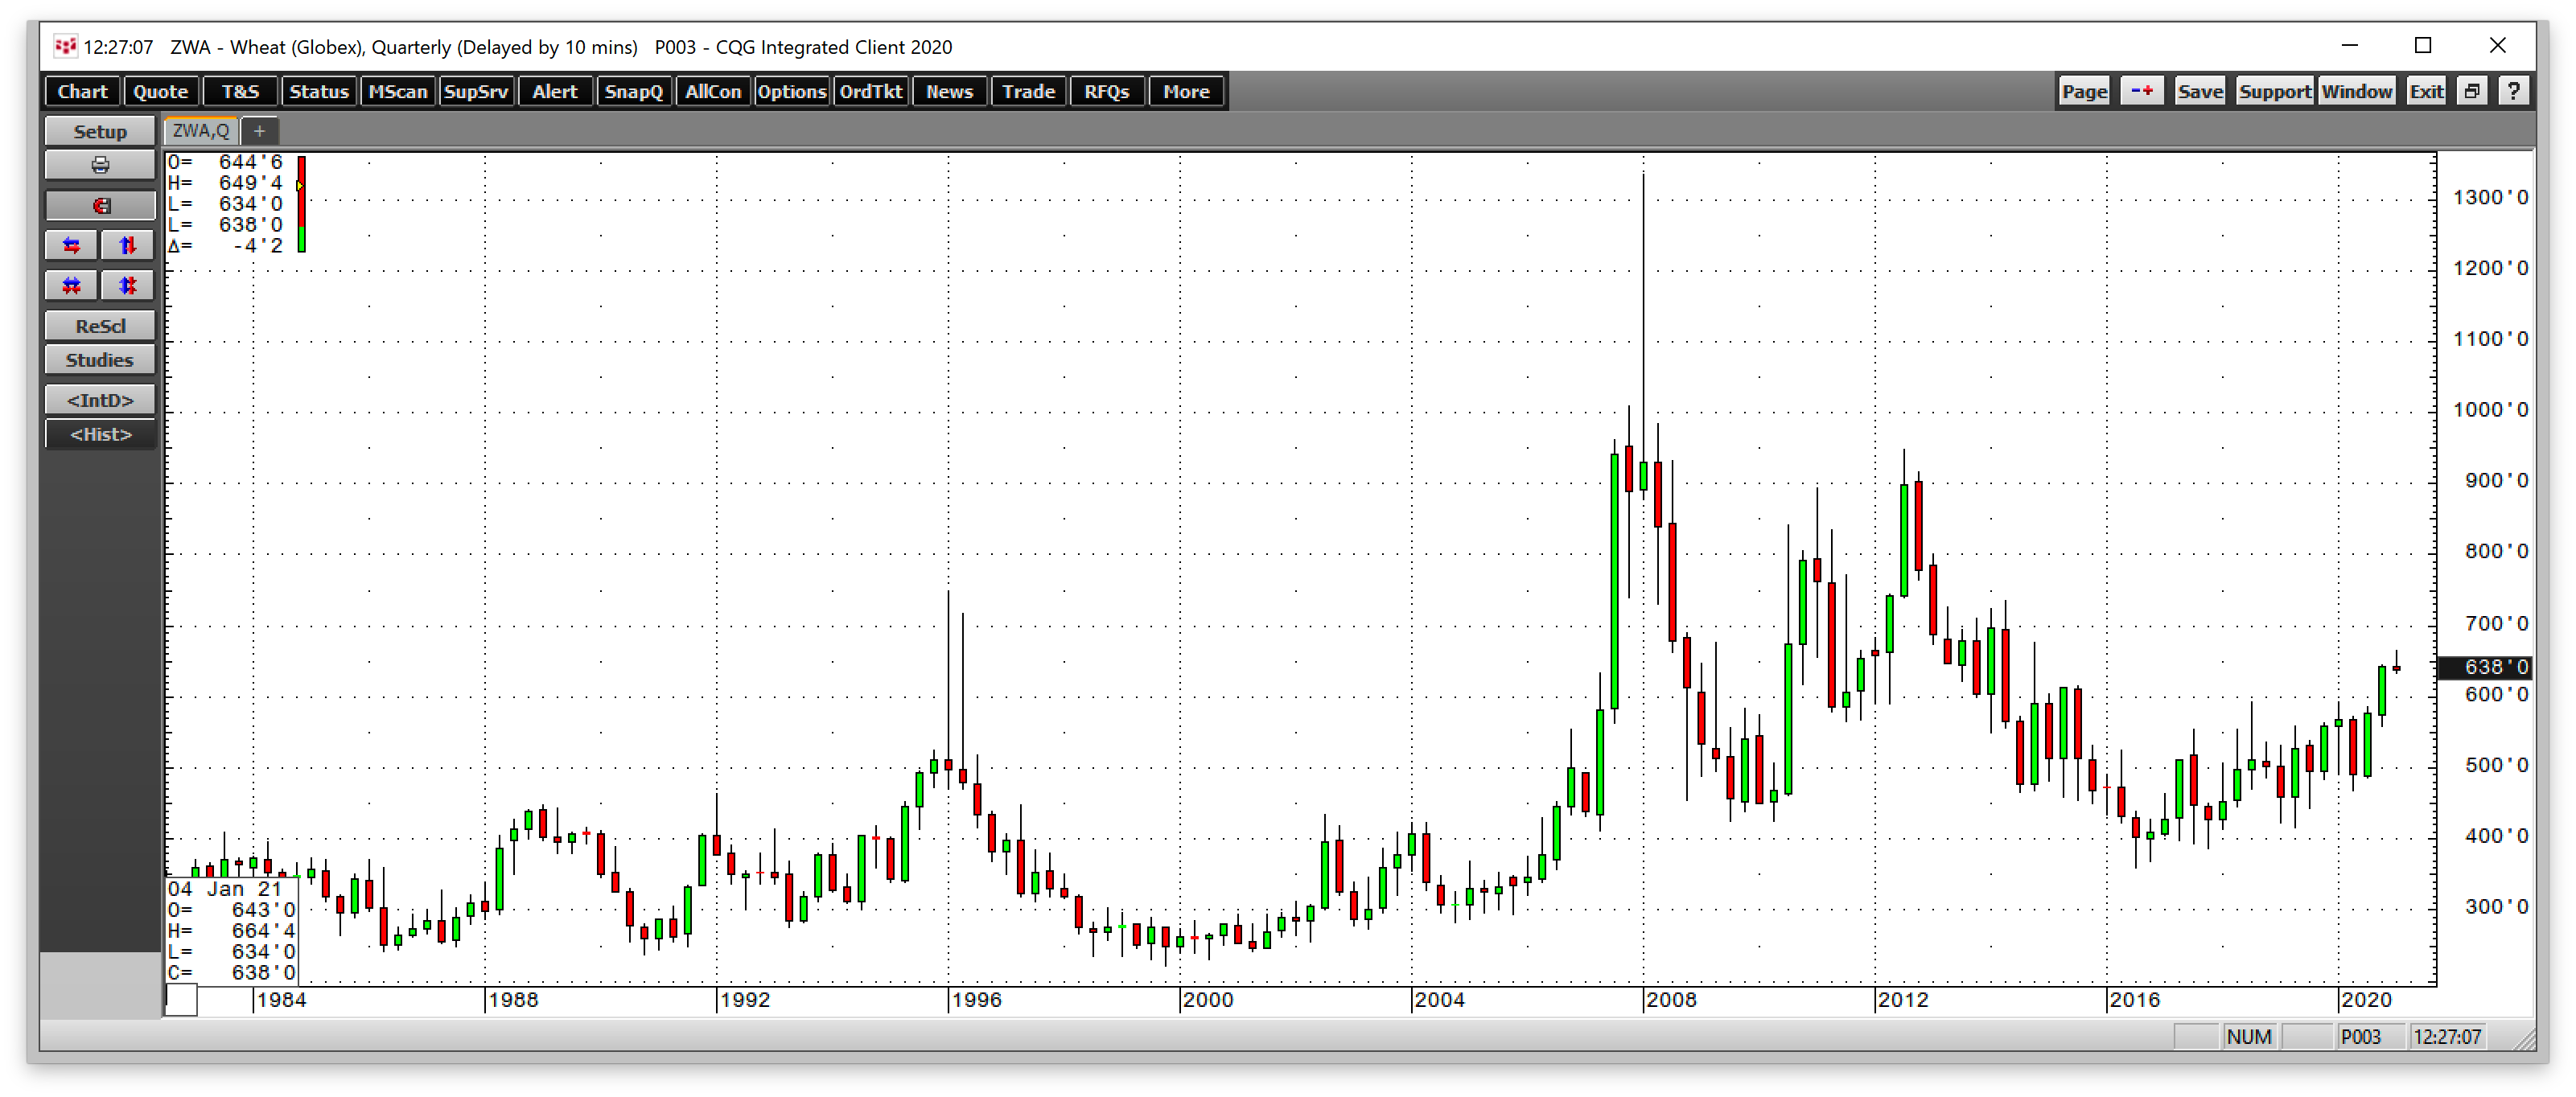
CBOT wheat futures peaked at $6.6450 last week and were at the $6.38 level. Wheat climbed to its highest level since October 2014.
All of the leading grains were sitting at their highest prices in over six years.
All about the weather
In South America, dry weather conditions have supported gains in the grain and oilseed futures markets over the past weeks. Increased demand for agricultural products further pushed prices higher.
At the beginning of 2021, the next crop year in the most significant growing regions in the northern hemisphere is only months away. In March and April, farmers will plant grains and oilseeds that feed the world.
The producers are heading into the planting season with the highest prices in over half a decade. They have had an opportunity to hedge future crops at the best levels in years. Meanwhile, Mother Nature will ultimately determine the path of grain and oilseed prices over the coming months.
The most significant risk facing the markets is a drought or any other weather event that causes crop production to fall. After the technical moves to the upside, any supply shortages could cause explosive moves to the upside and new all-time highs in the futures markets.
Grains will remain strong
A continuation of the bullish trends in the soybean, corn, and wheat futures market depends primarily on the weather conditions across the United States’ fertile plains and other critical growing areas worldwide. However, three factors will continue to underpin the agricultural commodity markets over the coming weeks and months:
At the end of 2020, soybean prices were almost 39.5% higher than at the end of 2019. Corn rose over 28.2%, and CBOT wheat futures were up 14.6%. All three grains were near the Dec. 31, 2020 closing levels at the end of last week, with all three rising to new highs over the first week of 2021.
The ingredients that feed the world got a lot more expensive in 2020, and they are continuing to rise in early 2021.
