Back in the summer, it was something investors could barely do without. Now, it’s something they can’t seem to run away from quickly enough.
In just four months, gold's fall from grace has been almost as breathtaking as its rise. As the global economy stuttered due to pandemic lockdowns, and the dollar and Treasury yields were battered by a gigantic US COVID-19 stimulus, gold was given a $400 or 25% boost between March and July that culminated in August’s all-time high of nearly $2,090 an ounce.
From there, in almost the exact same number of months, gold looks poised to return to where it was before it began its dizzying summer spiral. Driving it down this time is one potential COVID-19 vaccine development after another that have barely given long-only investors in the yellow metal a break. Adding to hedge fund and algorithm-driven liquidations is the selloff by Wall Street banks on the notion that a host of immunizations and therapeutics may actually bring the virus under control in a matter of months.
At Monday’s settlement on New York’s Comex, gold for February delivery was down $7.20, or 0.4% at $1,780.90 an ounce. It earlier hit $1,767.40, a low not seen since June 19, when it sunk to an intraday bottom of $1,745.50.
For the month, the benchmark US gold futures contract lost $112.50, or 6%. It was the yellow metal’s worst ever month since November 2016, when it fell by 7%.
Technical chartists have posited multiple support and breakout ranges for gold since its collapse began in earnest three weeks ago, amid the rash of positive vaccine news. Yet, the shiny metal has gone through one level after another, with no real assurance of its comeback.
Gold Needs A Substantive US Stimulus; Will It Get One?
If technicals don’t do it, the best thing to restore gold to its former glory will be another substantive US stimulus. Federal Reserve officials have been insisting for weeks that the US economy seriously needs more fiscal help, as do ordinary jobless Americans. The US central bank even pressed its case on Monday to continue with its COVID-19 lending program through Mar. 31, past the original Dec. 31 deadline. The European Central Bank is also expected to announce support measures later this month.
But, of course, nothing would charge gold higher like another US Congress-authorized stimulus, similar to the one issued in March.
Then, Democrats in Congress and Senate Republicans aligned with President Donald Trump passed, in a bipartisan fashion, the Coronavirus Aid, Relief and Economic Security Act (CARES). That $3 trillion bill provided grants and loans to US businesses and paycheck protection to qualifying citizens and permanent residents.
Since then, the two sides have been locked in a stalemate on a successive CARES package, arguing over the size of the next relief, as thousands of Americans, particularly those in the airlines sector, risk losing their jobs without further aid. The negotiations have been further complicated by Trump’s loss of the Nov. 3 presidential election to Democrat Joseph Biden, and the incumbent president’s refusal to work with his imminent successor.
On Monday, outgoing US Treasury Secretary Steven Mnuchin suggested Congress use $455 billion in leftover funds from the original CARES as “targeted relief” for the economy, instead of undertaking another major fiscal effort. Democrats have said a stimulus of at least $2 trillion is needed this time.
Georgia Senate Runoffs Hold Key
In order for President-elect Biden, who takes office on Jan. 20, to get a substantive fiscal package together, congressional Democrats need to secure a bipartisan deal with Senate Republicans—which might be close to impossible with the polarized state of the nation’s politics.
The other political solution would, of course, be the Biden administration taking control of the Senate—a situation possible if the Democrats win two run-off elections in the state of Georgia on Jan. 5. But as it stands, the outcome of those two races is a toss-up with no certainty on which side will prevail.
Rhona O'Connell, who heads EMEA and Asia market analysis for the StoneX Group, told the Platts energy markets service this week that Senate control will be the key for the next stimulus, adding, for both the economy and gold:
"If the Democrats manage to take the Senate after the Georgia runoff then the taps will be turned on. If not then expect more wrangling and a slower pace of recovery."
Technicals Say Gold Must Not Drop Below $1,1768 At Any Cost
Barring a Democrat takeover of the Senate, what do technicals show for gold?

Charts courtesy of SK Dixit Charting
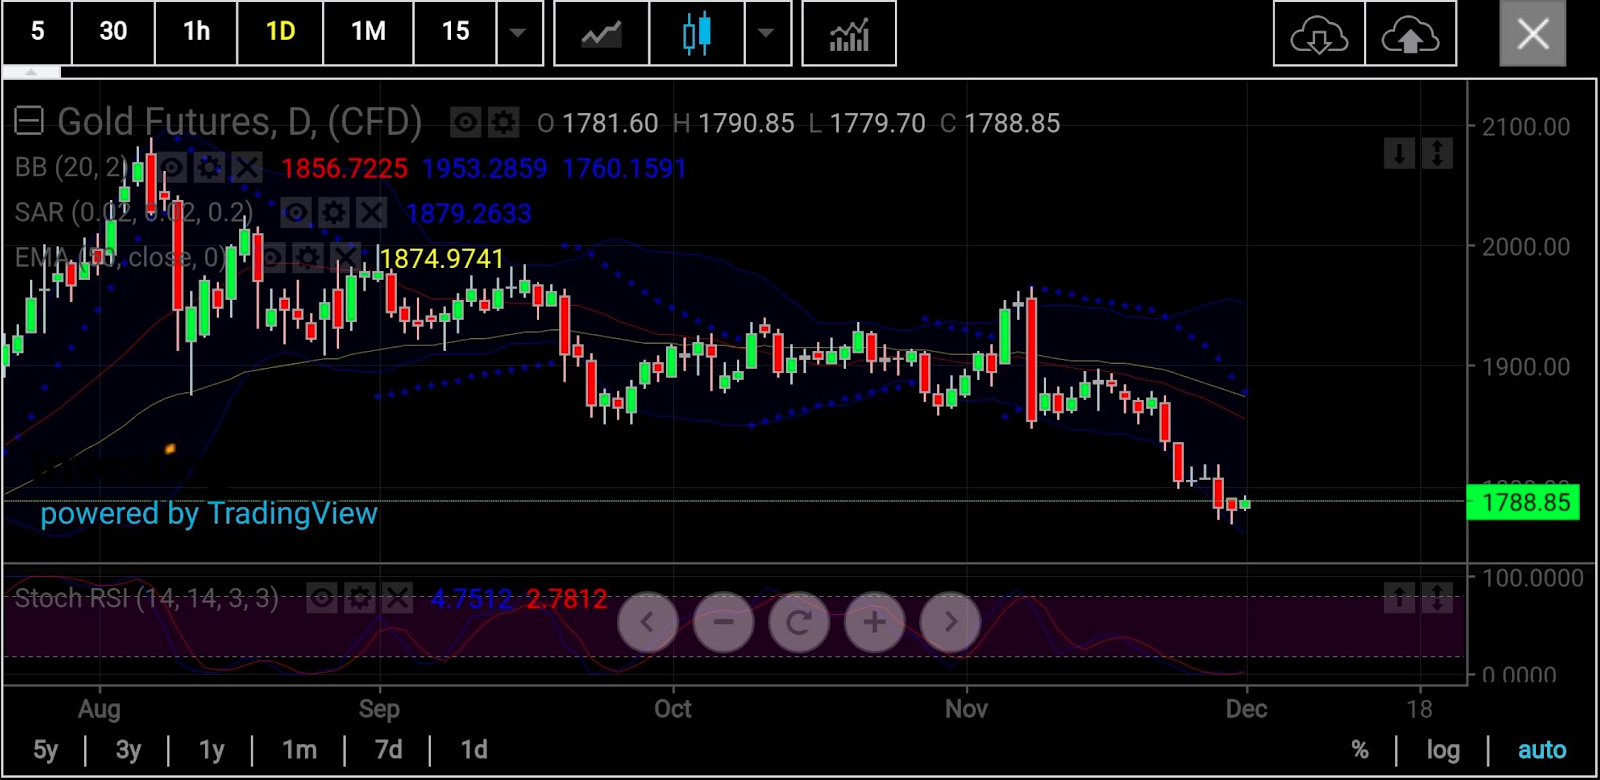
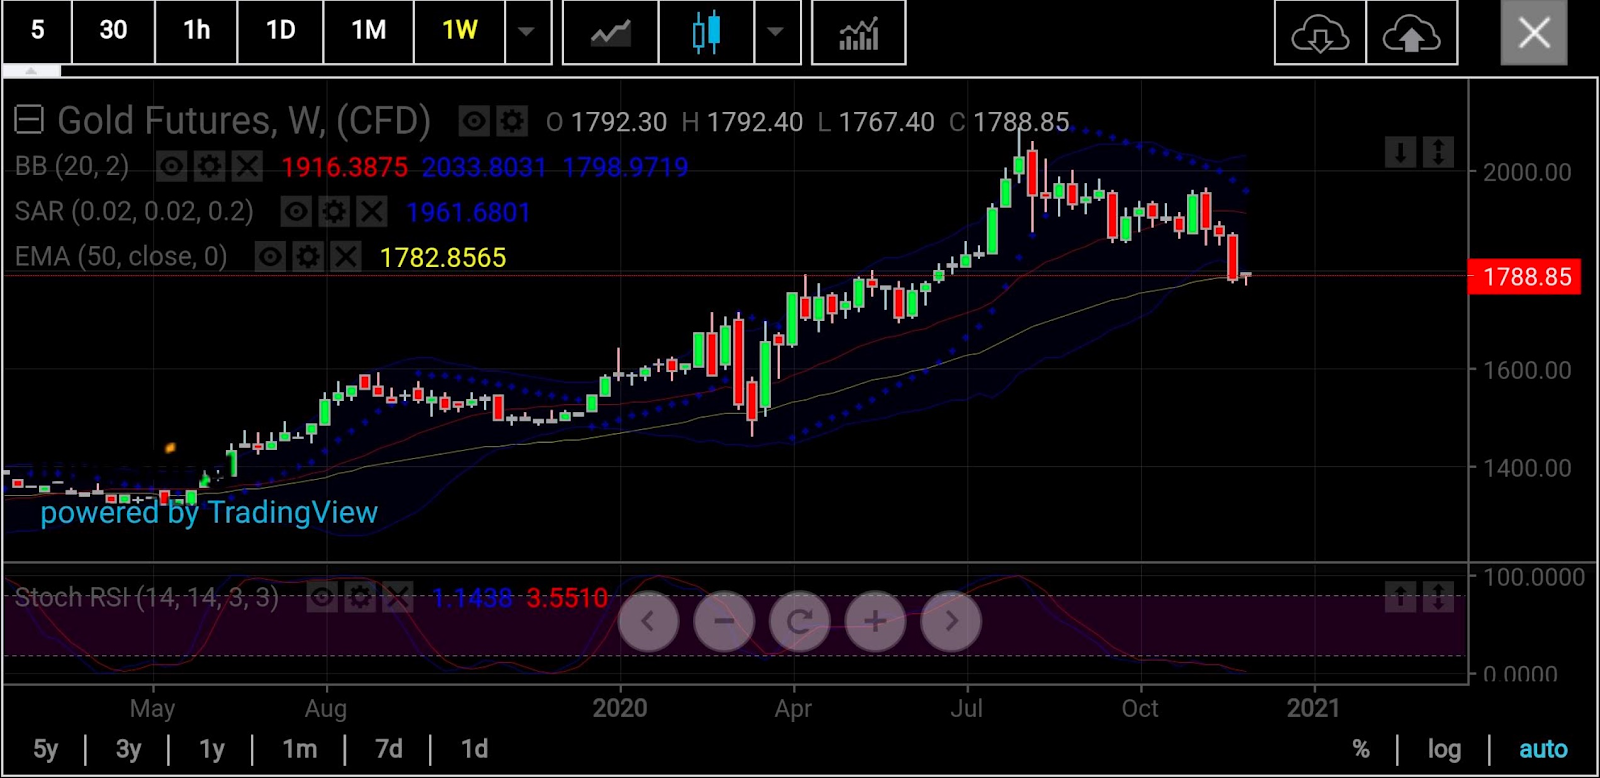
Sunil Kumar Dixit of Kolkata, India-based SK Dixit Charting says gold has a chance of even returning to $1,965 or plumbing $1,660—depending on the support it draws.
In a post issued Tuesday, Dixit said:
“Gold appears to be respecting the $1,768 support level, which coincides with the 50-Day Exponential Moving Average on the weekly chart, and is attempting to bounce off the lows as of now. If the momentum keeps up, then $1800-1817 should be on radar. A sustained move above 1817 can open gates for recovery to $1,848, which eventually points to an upside acceleration of $1,902, $1,931 and $1,965.”
“But failure to hold the $,1768 support may push gold even lower, to $1,748, $1,688 and $1,660.”

Anil Panchal, another gold chartist who blogs on FX Street, concurred with Dixit’s view, saying that while gold’s oversold Relative Strength Indicator favored buyers, underlying bearish patterns were keeping sellers hopeful. He added:
“Failures to cross 50-Hour Moving Average and short-term resistance line are some extra points favoring the gold bears.”
“An upside clearance of the $1,786 resistance confluence needs to cross a falling trend line from Nov 26, currently near $1,798 before confirming the further recoveries. During the sustained run-up past-$1,798, the $1,800 round-figure holds the key to further north-run towards September’s low around $1,849.”
Investing.com’s own Daily Technical Indicator for spot gold suggests a “Strong Sell”, with Fibonacci support first at $1,770.50, then at $1,764.34 and later at $1,754.37.
Should the trend turn positive, then bullion will likely find Fibonacci resistance first at $1,790.44, then $1,796.60, before full-scale selling pressure that mounts at $1,806.57.
The pivot point between both these ranges is $1,780.47.
As with all projections, we urge you to follow the calls but temper them with fundamentals—and moderation—whenever possible.
Disclaimer: Barani Krishnan uses a range of views outside his own to bring diversity to his analysis of any market. He does not own or hold a position in the commodities or securities he writes about.
