Summary: There's currently a tradeable set-up in gold. Sentiment, seasonality and the price pattern (especially the 2% intraday reversal on Friday) are all favorable. Importantly, there is a clear stop if price fails to rally. An even better set up exists on further weakness in gold under $1000.
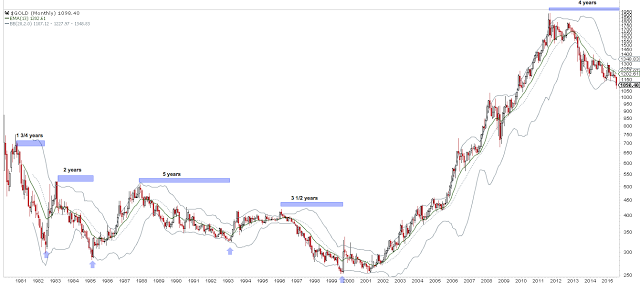
Gold has been in a protracted bear market for exactly 4 years. This qualifies as one of the longest bear markets for gold since 1980. It also follows a 10 year bull market for the metal, the longest during this time period.
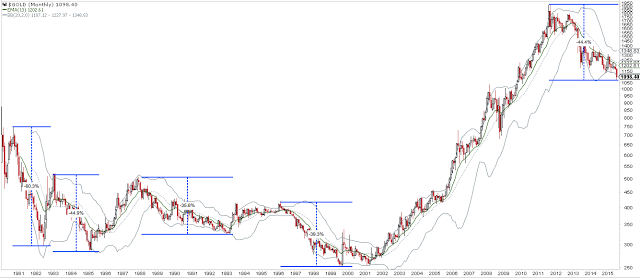
Gold has fallen by more than 40% since 2011. This is one of the largest declines in price since 1980. Of course, this is after a 7x rise in price during 2001-2011.
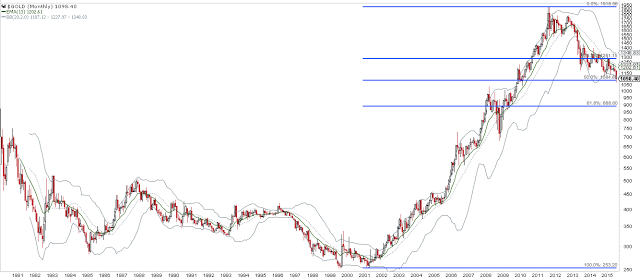
The recent decline is a 50% retracement of the prior bull market.
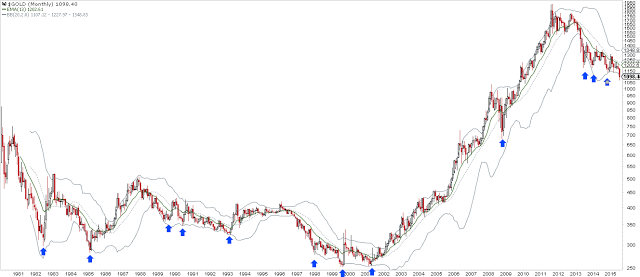
An interesting, and unusual, aspect about the price of gold is that it is prone to sharp reversals. Many asset prices fall, form a base and then reverse. In contrast, gold rallies have often been quick turnarounds.
After a 4 year bear market in which the metal has fallen more than 40%, gold sentiment is at a 10 year low (data from Bloomberg).
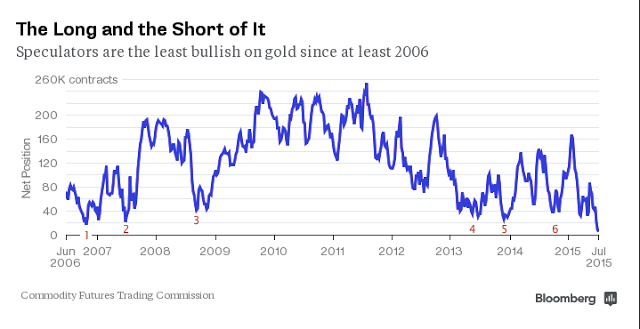
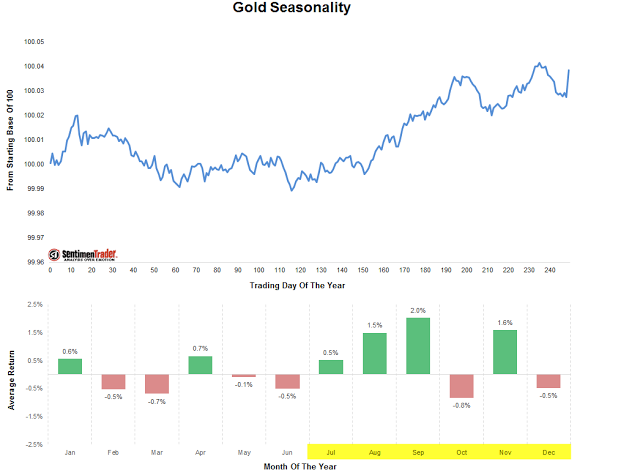
This is important, since gold rallies have corresponded with troughs in sentiment. The numbers on the chart below correspond to those above.
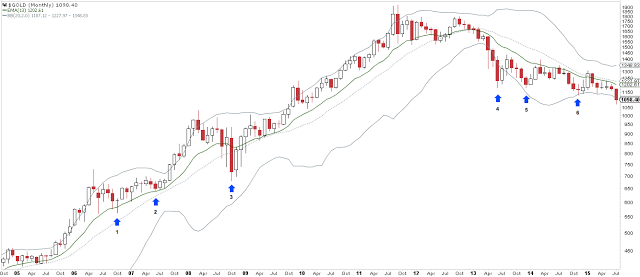
Of note, August and September are two of the most favorable months of the year for appreciation in gold prices. The trend is generally higher in the second half of the year (data from Sentimentrader).
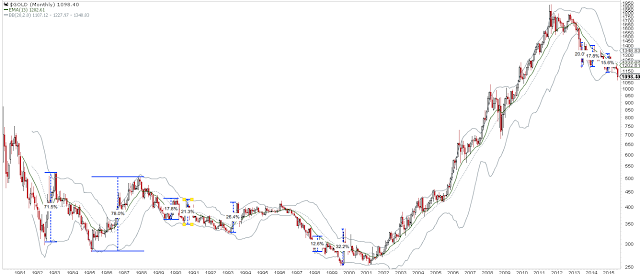
If gold were to rally now, how much could would price rise? Leaving aside the 2001-11 bull market, most of the the rallies in gold have been 15-20%. That's also the size of the three most recent rallies in gold during the past 3 years.
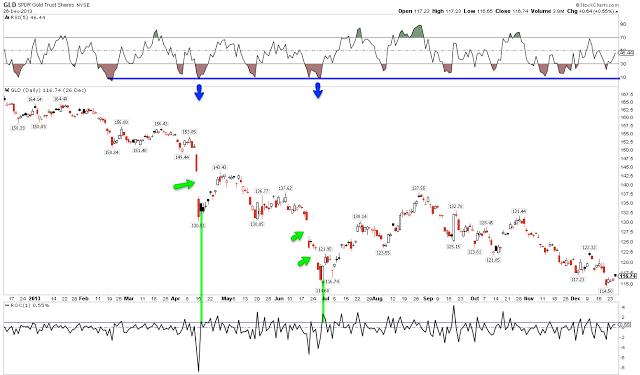
We've seen a similar pattern before recent rallies in gold prices: a significant gap down (green arrows); which has caused RSI(5) to fall under 5 (top panel); followed by a 1% gain in a single day (green lines). In other words, selling has reached an extreme and then a large buyer has taken a long position.
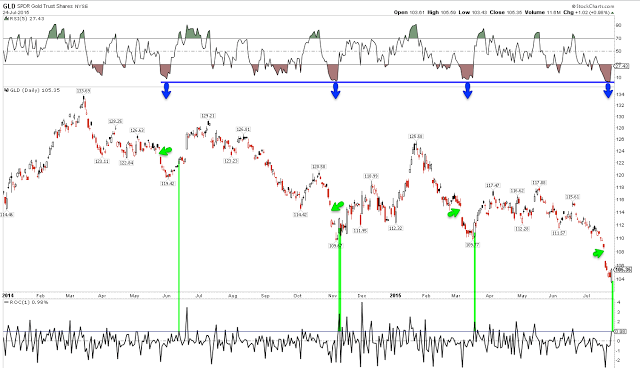
This pattern is not perfect. It marked rally lows in 2013 but there were some false lows in February and early June, too. This is why a stop below the recent low is important (103.4 was the Friday low in SPDR Gold Shares (ARCA:GLD)).
Overall, there are some good reasons to expect gold to rally: sentiment, seasonality and the price pattern (gap down, oversold with a 2% intraday reversal on Friday). Importantly, there is a clear stop.
The current set-up is not perfect. Price entered a volume vacuum last week; that's why it fell so hard. There is stronger support for gold below $1000 ($100 for GLD). The set-up from that level is stronger.

