- A familiar pattern appears to be emerging for volatility
- Calm market conditions in Q2 could feed through into a further moderation in FX volatility
- Inflation concerns were likely trigger for market volatility in February
- Widening trade deficit with China indicates where risks might emerge
Over the past five years, the second quarter has proven to be a relatively benign period for equity markets. If this pattern was to repeat itself this year, it would likely feed through into declining volatility in the foreign exchange market during the next three months. In a pair of research notes issued this week, a Bank of New York Mellon strategist makes the case that this seems to be the most likely outlook. Still, it’s worth exploring what could upset this scenario.
Since U.S. markets began to stabilize in mid-February there's been a notable decline in volatility in the foreign exchange market, wrote Simon Derrick, chief currency strategist at the bank.

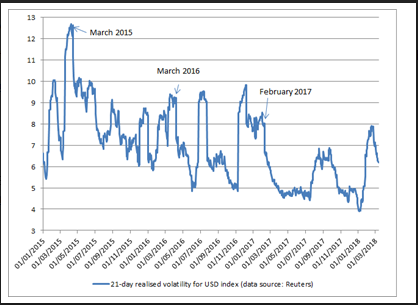
One measure of this, 21-day realized volatility in the U.S. Dollar Index has declined from 7.8% to below 6.2%. This broadly repeats a pattern seen over the previous three years.
While history does not necessarily provide a guide to what happens next, this pattern of a benign second quarter certainly seems to have held over the past five years,” Derrick wrote.
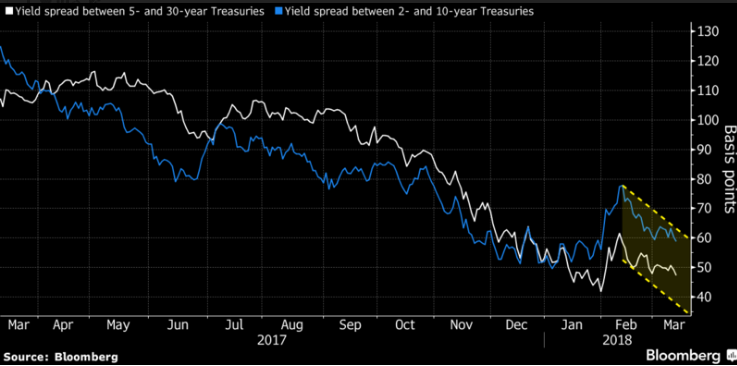
Flattening yield curve
The rise in volatility in 2017 differed from that seen in the previous two years to the extent that it had little to do with heightened uncertainty in the equity markets, but instead seemed to be connected to changing attitudes towards the dollar itself.

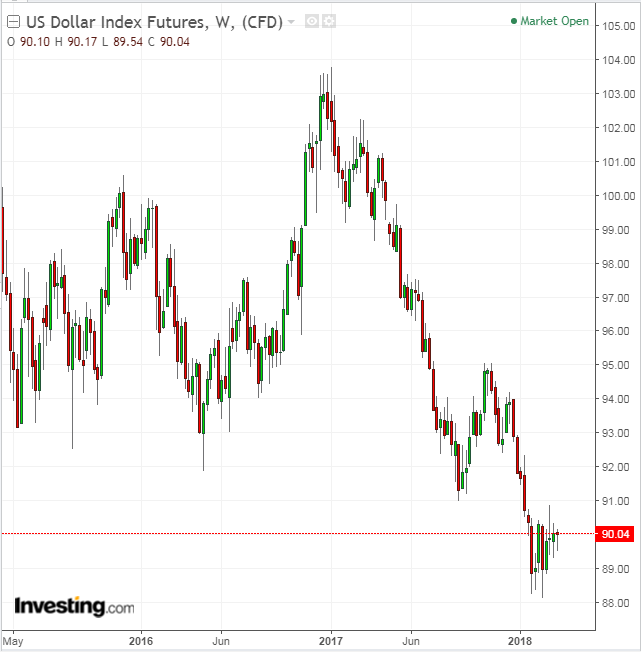
Having started the year at its highest level in a decade and a half, a resumption of the dominant trend towards yield curve flattening, along with some uncertainty around the new U.S. administration’s attitude towards currency policy, saw the Dollar Index reverse trend, resulting in a rise in volatility.
Equally, as equity markets regained their composure and the U.S. yield curve started to flatten again, volatility in the Dollar Index began to decline, much as it did in 2015, 2016 and 2017. The increase in volatility seen in January and the first half of February seemed to echo the pattern seen in both 2015 and 2016.
At the start of 2015, market volatility spiked as a result of a collapse in oil prices and radical shifts in European monetary and currency policy (particularly by the European Central Bank and the Swiss National Bank), while in early 2016 much of the focus had centered on Chinese currency policy.
Inflation concerns
In 2017 a likely initial catalyst for the unrest that hit U.S. markets was the Federal Reserve’s January 31 rate statement, which indicated growing concerns over inflation, Derrick said.
The FOMC statement noted that "market based measures of inflation compensation have increased in recent months but remain low," a tweak from December's language which simply said that the measures "remain low."

The yield curve steepened in the days following the statement, feeding through into a sharp decline in equity indices (coupled with an equally sharp rise in volatility). “Tellingly, it was the weakness in the equity markets rather than the steepening of the yield curve that appeared to act as the catalyst for the subsequent recovery in the dollar and a continued rise in foreign exchange realized volatility,” he said.
What does this mean for the rest of the year?
Given that inflation concerns were the likely trigger for the market volatility seen in early February, it makes sense to believe that inflation and trade data will become a key focus as the year progresses, Derrick argues.
He said that it’s worth noting that the only two times headline inflation moved above 4% in the U.S. in the past quarter of a century came in 2005 and 2008. In both cases oil prices had been rising sharply over the previous 12 months as had the Chinese yuan.
However, the U.S. economy has changed markedly over the past decade, most notably by becoming significantly more energy independent. But the U.S. trade deficit has remained surprisingly high, hovering between $35 billion and $50 billion for much of the past decade.
The deficit has widened rapidly since the start of this year, jumping 5% in January alone to hit $56.6 billion, its highest level since October 2008. The deficit with China increased by 16.7% to $36 billion on the month, which is why the USD/CNY's 8.4% decline over the past 12 months matters.
Should imported inflation start to become an issue, the key to what happens next in markets will be how the yield curve reacts, Derrick writes. If yield curve steepening feeds through into further equity market unrest, it also seems likely (given what happened in February) that this would be matched by renewed dollar strength along with a rise in foreign exchange market volatility.
None of this appears an immediate risk as indicated by Tuesday’s inflation data Derrick said, but added that this pattern could change during the latter part of the year.
