Breaking News
Get 45% Off 0
Is it finally time to sell Nvidia ahead of earnings?
Read More

Financial Data at Your Fingertips: Uncover a Universe of Insights on a Single Page

By Investing.com (Laura Sánchez)Market OverviewNov 25, 2023 22:00
au.investing.com/analysis/financial-data-at-your-fingertips-uncover-a-universe-of-insights-on-a-single-page-200583372
Financial Data at Your Fingertips: Uncover a Universe of Insights on a Single Page
By Investing.com (Laura Sánchez)   |  Nov 25, 2023 22:00
Saved. See Saved Items.
This article has already been saved in your Saved Items
 
  • As investors, we must glean crucial information about the companies on our radar when repositioning our portfolios.
  • InvestingPro's 'Data Explorer' allows you to search for all the data you need among hundreds of possible metrics.
  • Be it the solvency ratio, basic EPS growth, Piotroski score, or return on assets, you can discover all the value-added information about companies in one place.
  • Find out which stocks are trading at a discount this Black Friday with our exclusive InvestingPro offer.
  • In the dynamic world of markets, access to the best information is paramount for informed investment decisions.

    InvestingPro, the professional tool from Investing.com, provides a diverse range of value-added information crucial for effectively managing our portfolios.

    Among the options offered by InvestingPro, the 'Data Explorer' section stands out, which displays financial information on companies according to a wide variety of metrics.
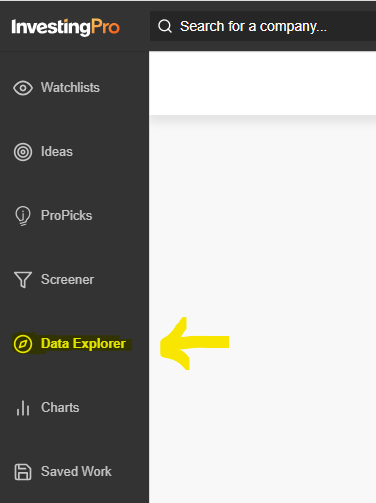
    InvestingPro Data Explorer
    InvestingPro Data Explorer

    Source: InvestingPro

    It offers a search engine with several options. These include solvency ratio, basic EPS (earnings per share) growth, Piotroski score, return on assets, return on capital employed, return on common equity, revenue, etc.
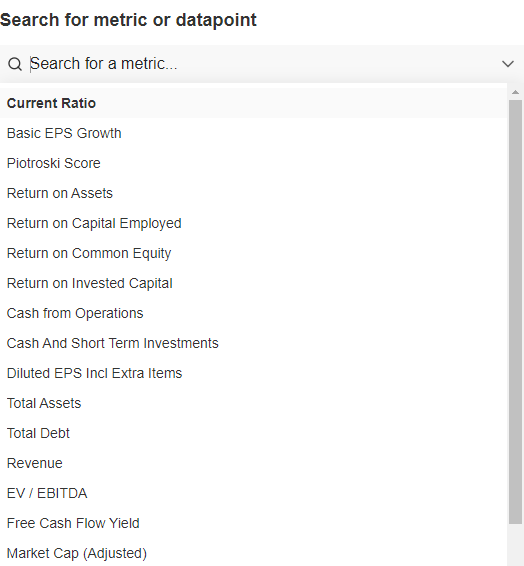
    Search for Data Point
    Search for Data Point

    Source: InvestingPro

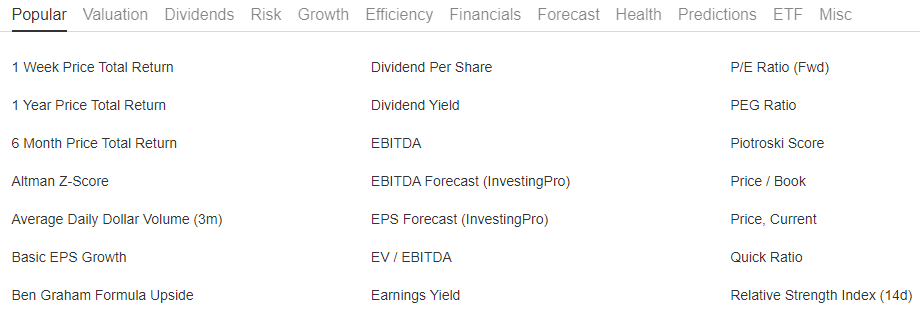
    The data explorer also offers information according to the options that may be most useful to the investor: Most Popular, Valuation, Dividend, Risk, Growth, Efficiency, Fundamental, Forecast, Status, Predictions, or ETF, among others.

    Categories
    Categories

    Source: InvestingPro

    In each category, InvestingPro offers metrics sorted in alphabetical order.

    The 'most popular' financial metrics are:

    • 1-week total price return: total price change (adjusted for dividends and splits where applicable) over the last 1 week.
    • 1-year total price return: Total price change (adjusted for dividends and splits where applicable) over the last 1 year.
    • 6-month total price return: Total price change (adjusted for dividends and splits where applicable) over the last 6 months.
    • Altman Z-Score: Formula used to predict the probability of a company going out of business within 2 years.
    • Average daily dollar volume (3m): Three-month average of shares traded each day multiplied by the share price.
    • Basic EPS growth: Growth in basic EPS for a quarter versus the previous quarter.
    • Ben Graham Formula Increment: Percentage upside (if positive) or downside (if negative) an investor can expect relative to the current stock price based on the Ben Graham formula value. The Ben Graham formula value estimates the intrinsic value of a stock based on a formula inspired by investor and professor Benjamin Graham.
    Financial Metrics
    Financial Metrics

    Source: InvestingPro

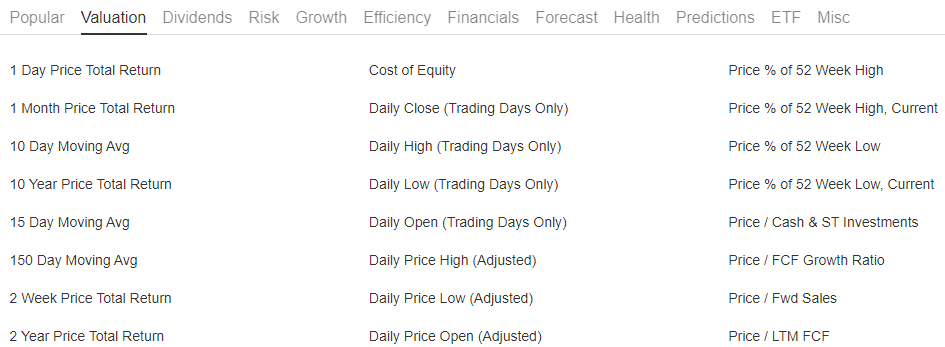
    Under the 'Valuation' tab, you can find more than 170 metrics. Among them, the following stand out:

    • Age of quoted price: Indicates the length of time since the last quote. The value is one of the following: delayed, real-time, end-of-day, or unavailable.
    • EV/EBITDA ratio: Technique used to measure the level of EBITDA growth in relation to the EV/EBITDA multiple.
    • Share turnover ratio: This item represents the three-month average volume divided by a company's outstanding shares.
    Financial Metrics
    Financial Metrics

    Source: InvestingPro

    In this analysis, we have discussed all the metrics available in 2 tabs, but there are still 10 other tabs that offer comprehensive information about the stock in question.

    In a volatile market where strategic decisions can significantly impact our portfolio, possessing the most accurate market information becomes indispensable.

    Utilizing InvestingPro's data explorer ensures direct access to market data that can enhance your portfolio's performance.

    Read also:

    • 7 Steps to Filter Out Market Noise and Maximize Your Profits
    • How to Filter the Market for the Best Stocks to Buy Today

    ***

    Buy or Sell? Get the answer with InvestingPro for Half of the Price This Black Friday!

    Timely insights and informed decisions are the keys to maximizing profit potential. This Black Friday, make the smartest investment decision in the market and save up to 55% on InvestingPro subscription plans.

    Whether you're a seasoned trader or just starting your investment journey, this offer is designed to equip you with the wisdom needed for more intelligent and profitable trading.

    Disclaimer: This article is written for informational purposes only; it does not constitute a solicitation, offer, advice or recommendation to invest as such and is in no way intended to encourage the purchase of assets. I would like to remind you that any asset class is evaluated from multiple points of view and is highly risky. Therefore, any investment decision and the associated risk remains with the investor.

Financial Data at Your Fingertips: Uncover a Universe of Insights on a Single Page
 

Related Articles

James Picerno
Politics and Policy Clouds Path Ahead for Fed By James Picerno - Feb 26, 2025

The central bank’s job is never easier, but in the current climate, it’s unusually tricky. In addition to the usual challenges that complicate real-time monetary policy decisions,...

Charles-Henry Monchau
7 Key Charts on the Current State of the Global Economy By Charles-Henry Monchau - Feb 25, 2025 1

The EU’s most costly budgets, bitcoin’s market swings, and rising US bankruptcies. Each week, the Syz investment team takes you through the last seven days in seven charts. 1. The...

Lance Roberts
Margin Balances Suggest Risks Are Building By Lance Roberts - Feb 25, 2025

Last week, we discussed that continued bullish exuberance and high levels of complacency can quickly turn into volatility. As we noted then, introducing an unexpected, exogenous...

Financial Data at Your Fingertips: Uncover a Universe of Insights on a Single Page

Add a Comment

Comment Guidelines

We encourage you to use comments to engage with users, share your perspective and ask questions of authors and each other. However, in order to maintain the high level of discourse we’ve all come to value and expect, please keep the following criteria in mind: 

  • Enrich the conversation
  • Stay focused and on track. Only post material that’s relevant to the topic being discussed.
  • Be respectful. Even negative opinions can be framed positively and diplomatically.
  •  Use standard writing style. Include punctuation and upper and lower cases.
  • NOTE: Spam and/or promotional messages and links within a comment will be removed
  • Avoid profanity, slander or personal attacks directed at an author or another user.
  • Don’t Monopolize the Conversation. We appreciate passion and conviction, but we also believe strongly in giving everyone a chance to air their thoughts. Therefore, in addition to civil interaction, we expect commenters to offer their opinions succinctly and thoughtfully, but not so repeatedly that others are annoyed or offended. If we receive complaints about individuals who take over a thread or forum, we reserve the right to ban them from the site, without recourse.
  • Only English comments will be allowed.

Perpetrators of spam or abuse will be deleted from the site and prohibited from future registration at Investing.com’s discretion.

Write your thoughts here
 
Are you sure you want to delete this chart?
 
Post
Post also to:
 
Replace the attached chart with a new chart ?
1000
Your ability to comment is currently suspended due to negative user reports. Your status will be reviewed by our moderators.
Please wait a minute before you try to comment again.
Thanks for your comment. Please note that all comments are pending until approved by our moderators. It may therefore take some time before it appears on our website.
 
Are you sure you want to delete this chart?
 
Post
 
Replace the attached chart with a new chart ?
1000
Your ability to comment is currently suspended due to negative user reports. Your status will be reviewed by our moderators.
Please wait a minute before you try to comment again.
Add Chart to Comment
Confirm Block

Are you sure you want to block %USER_NAME%?

By doing so, you and %USER_NAME% will not be able to see any of each other's Investing.com's posts.

%USER_NAME% was successfully added to your Block List

Since you’ve just unblocked this person, you must wait 48 hours before renewing the block.

Report this comment

I feel that this comment is:

Comment flagged

Thank You!

Your report has been sent to our moderators for review
Continue with Apple
Continue with Google
or
Sign up with Email