Just three years ago, world GDP was growing at 3% a year, but copper prices were falling more than 20%. Here was Dr. Copper, the metal so called for its supposed ability to diagnose any ailment in the economy; yet the disconnect was rankling.
Now, copper prices are nearing record highs as the global economy is struggling to free itself from the coronavirus. It is still a disconnect.
But markets are celebrating this time because of the forecast that the world will emerge from the pandemic sooner rather than later. Hence, Dr. Copper is living up to its billing of being able to foretell the path of the economy.
Three-month copper futures on the London Metal Exchange rose above $9,000 a metric ton on Monday for the first time in nine years, nearing their all-time high of around $9,945 set in April 2011, as investors bet that supply tightness will increase as the world recovers from the pandemic.
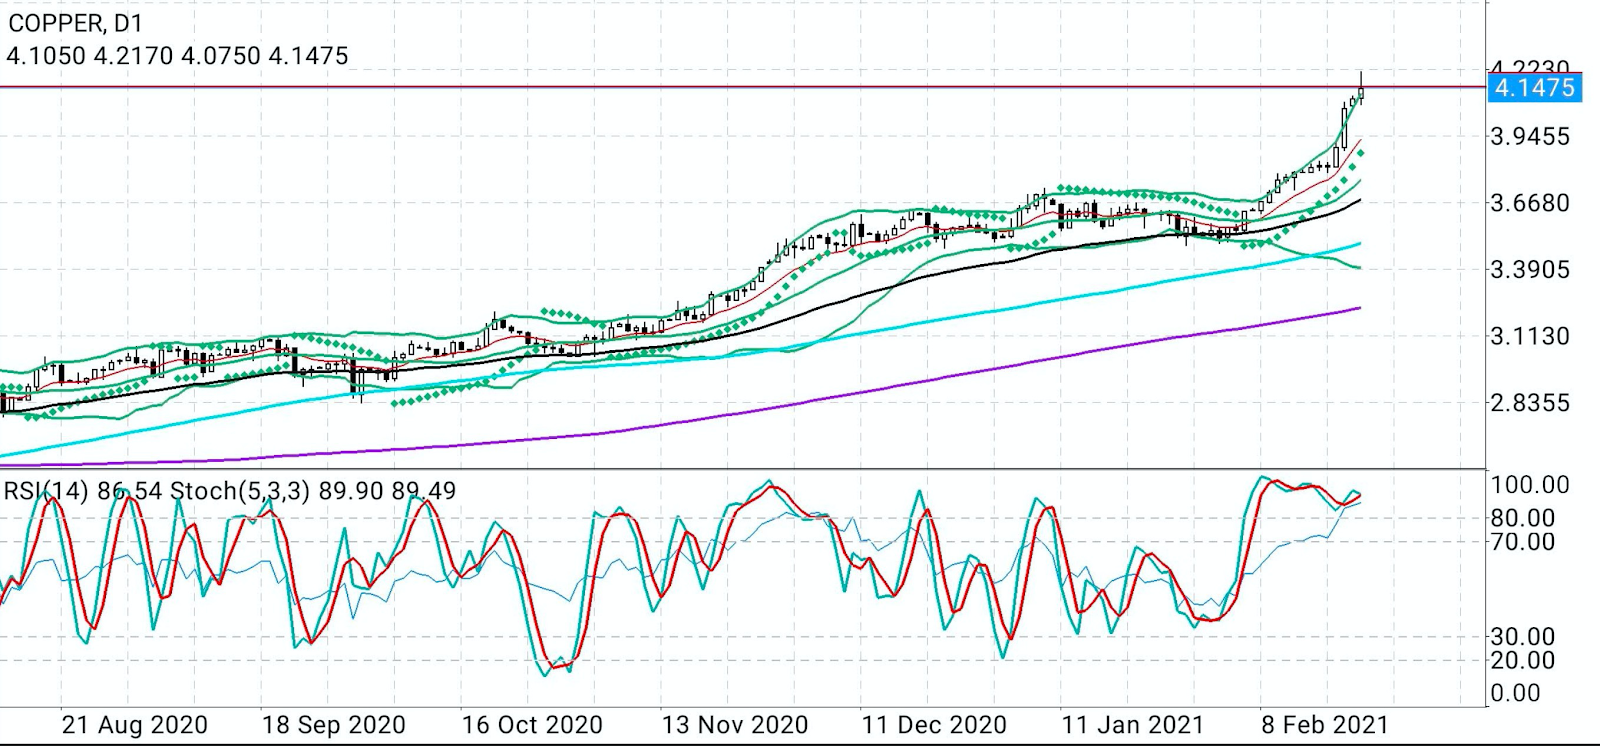
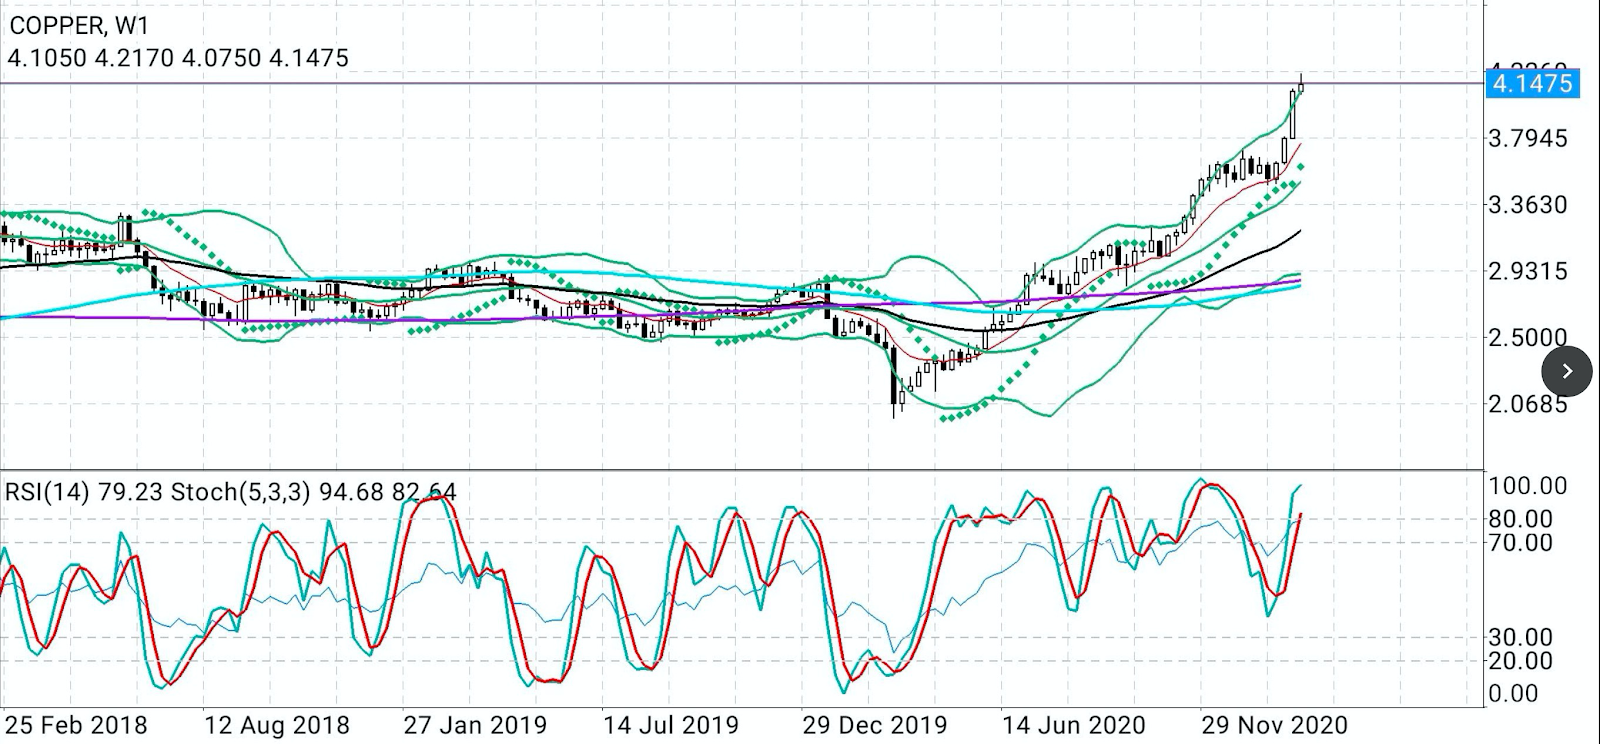
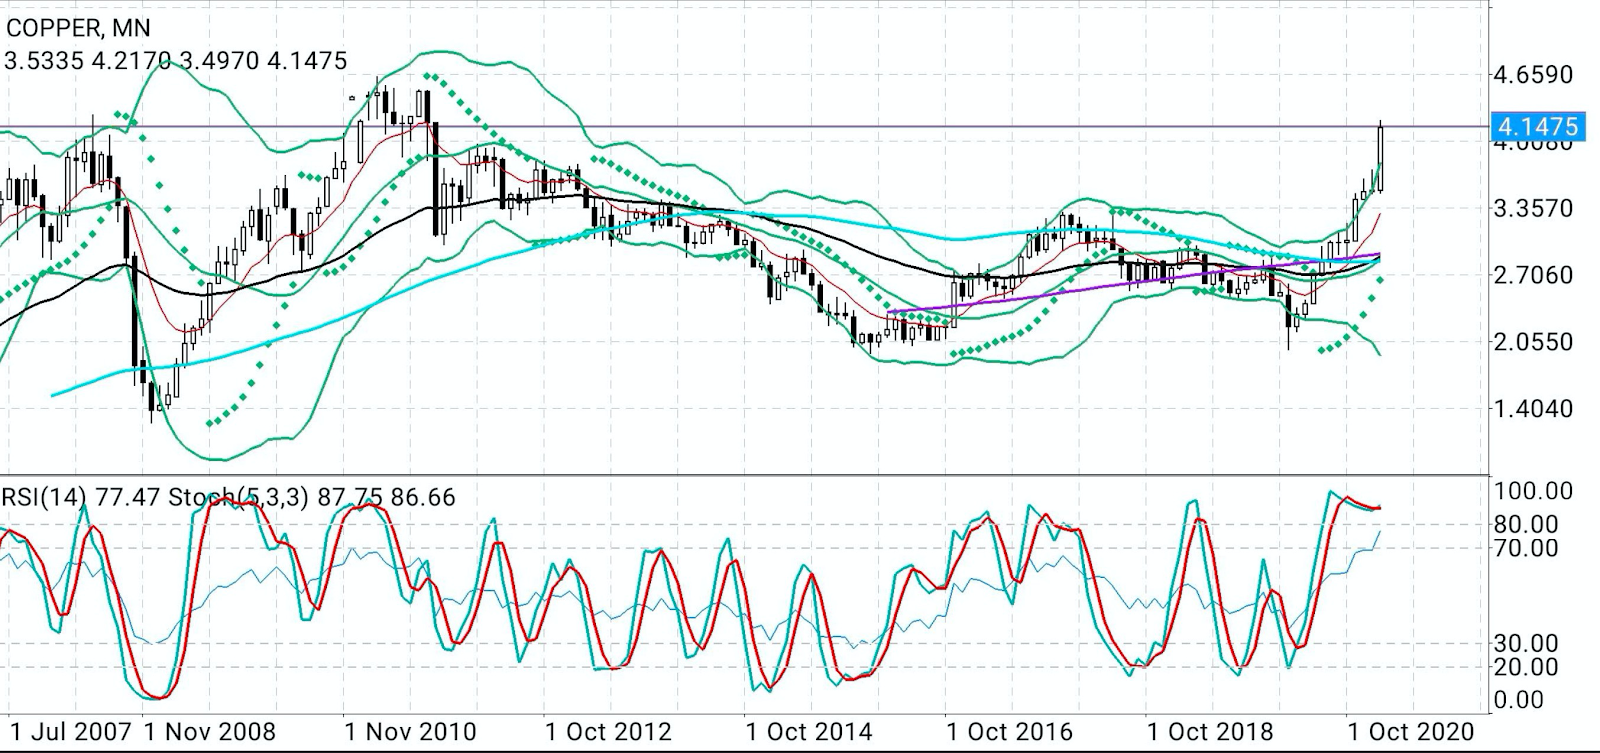
On New York’s COMEX, US copper for May delivery touched $4.22 a lb, its loftiest level since an August 2011 high of $4.50 on hopes that President Joseph Biden’s upcoming $1.9 trillion COVID-19 stimulus package will lead to a “reflation” of the US economy.
Reflation, Inflation Or Stagflation?
Reflation is a fiscal or monetary policy designed to expand output, stimulate spending, and curb the effects of deflation, which usually occurs after a period of economic uncertainty or a recession.
It’s also used at times to describe the first phase of economic recovery after a period of contraction. The dollar typically weakens in periods like this, boosting prices of commodities in what’s known as the “reflation trade.”
Some think the reflation expected in the US economy is nothing more than good, old-fashioned inflation that will be making a comeback after nearly a year of gloom. Some economists even predict there will be “stagflation,” or persistent high inflation combined with high unemployment and stagnant demand in the economy.
Whatever the case, the prediction for copper prices is sky-high.
Copper Seen At $10,000 On LME And $5 On COMEX
Max Layton, head of EMEA commodities research at Citigroup, told Bloomberg on Monday that the list of bullish factors for copper was “extremely long,” adding:
“A lot of the most bullish developments are really going to play out in the next few months, and therefore we think it’s going to be sooner rather than later that it gets to $10,000.”

All charts courtesy of SK Dixit Charting
Sunil Kumar Dixit, technical chartist at SK Dixit Charting in Kolkata, India, predicted COMEX copper as high as $5 an ounce, smashing the New York record of $4.625 set in August 2011. Dixit explained:
“COMEX copper has cleared $3.30, $3.80 and $4.10 like a hot knife through butter. The current momentum suggests that the red metal is all set to take on 2011 record high of $4.63. If this comes to pass, which is very likely, bulls may not rest and then $5 copper is on the cards.”

Further on COMEX copper technicals, the Stochastic Relative Strength Index was pointing north across the daily, weekly and monthly charts, while major Moving Averages were also bullish, giving a strong shout-out for further continuation of the bull run, he said.

Dixit, however, cautions that the wind behind copper could turn too, though not for long.
“On the flip side of the momentum, a daily and weekly close below $4.07 should be seen as the first sign of the beginning of price distribution and correctional move leading to some lower prices toward the 10-week EMA (Extraordinary Moving Average) of $3.76 and 50-Day EMA of $3.68.”
Tidal Wave Of Buying That’s Lifting Most Commodities
But it’s not just copper that’s rallying. Almost every commodity, from oil to gold, silver and corn have been swept up in a tidal wave of buying spurred by a flood of cheap money seeking sexy returns as central banks across the world maintain record low interest rates to spur recovery from COVID-19.
In copper’s case, the rally has been long coming.
Often seen as a measure of the global economy, the metal has rallied almost without stop for a year now, largely on support from top metals buyer China, which emerged from COVID-19 lockdowns way before the rest of the world.
But over the past decade, the disconnect between the red metal and the economy has been so great that to the uninitiated, the mere utterance of Dr. Copper might have elicited the response: Dr. Who?
Notwithstanding the 2008-2009 financial crisis, world gross domestic product grew by a compounded 29% in the 2000-2009 period, or at an average clip of 2.9% per annum.
Copper prices, in comparison, started January 2000 at 86 cents a lb on COMEX and finished December 2009 at $3.33. That’s a whopping 287% growth. Clearly, copper in this era wasn’t just reflecting the economy—it was front-running it.
Back to Hero Now From Zero?
The 2000-2009 story in copper unraveled over the next ten years.
While world GDP growth was almost exactly the same in the following decade, expanding by a compounded 30% between 2010 and 2019, or an average of 3% per annum, copper took a different path.
The metal’s prices on COMEX went from a January 2010 start of $3.33 per lb to a December 2019 close of $2.83. That was a 15% drop instead.
Analysis of the price action for that decade will show copper prices often being restrained by fears of economic slowdown that never materialized. The Trump administration’s intense trade war with China, the world’s largest copper buyer, also hurt demand and prices of the metal toward the end of those years.
Whatever the case, in a span of just two decades, copper as the world’s leading industrial metal, went from hero to zero.
Will that reverse now?
Disclaimer: Barani Krishnan uses a range of views outside his own to bring diversity to his analysis of any market. As an analyst for Investing.com he presents divergent views and market variables.
Comments are welcome and encouraged. Inappropriate comments will be reported and removed.
