Key Points:
- Recent Oil Inventories data showing builds
- Technical bias remains bearish
- Saudi Arabian oil production reaches new highs
Oil prices have been recovering rather strongly ever since bouncing off support around the beginning of August. The rally comes as somewhat of a surprising manoeuvre given the fact that US Oil Inventories have posted two builds in the same period.
However, these results may finally be about to catch up with the commodity as the Baker Hughes data is now reporting an uptick in the global rig count. Moreover, from a technical perspective, oil appears to be fast approaching a turning point which could see a move back below the $40 handle.
Firstly, from a fundamental angle, there seems to be growing evidence that WTI crude prices could be cruising towards yet another slip. Specifically, the commodity largely shrugged of the latest two US Crude Oil Inventories results, which came in it 1.41M and 1.06M respectively,and this led to a few raised eyebrows.
However, in addition to these builds, Baker Hughes has reported net increases in both the global rig count and the North American count. The increase in the American count is largely the result of rigs coming online in the Permian basin, one of the new playgrounds of US Shale Oil.

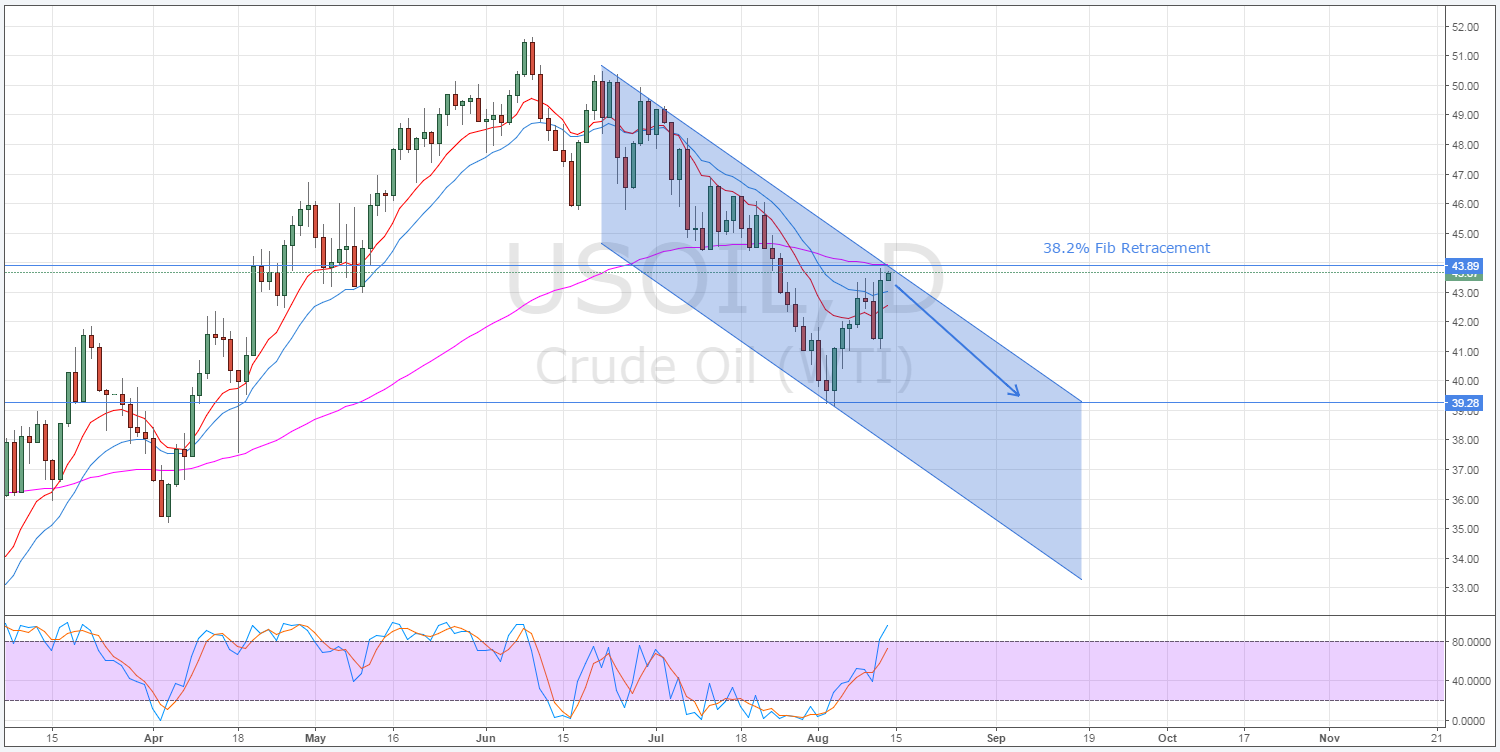
Setting aside the fundamentals, the technical analysis retains its long term bearish bias which could see another rout for oil in the coming days. One notable technical factor which is putting downside pressure on the commodity is the recent bearish channel formation.
As shown above, oil has finally moved to challenge the upside constraint of the channel and this could be the start of another protracted decline.
Given the strong recent performance of oil, it remains a possibility that the commodity could, in fact, simply brush aside resistance around the 43.86 level much as it did at the 41.67 mark. However, unlike the earlier zone of resistance, there are a number of technical factors in agreement which should dampen oil’s momentum at the 43.89 level.
Specifically, stochastics are already moving into overbought territory and causing buying pressure to weaken. Furthermore, the commodity is also contending with the bearish 100 day EMA which is supplying dynamic resistance.
Ultimately, the fundamentals and technicals are both signalling that there remains a high probability of a reversal at the 38.2% Fibonacci level around the 43.89 mark. If oil does retreat, the commodity is expected to fall back to at least the $40 handle but it could extend its losses and experience a more serious decline.
This looks all the more likely given that, as noted in OPEC’s recent minutes, Saudi Arabia is pumping out oil at record pace. Consequently, the oil bulls may have their recent hopes dashed as the global supply glut seems to be here to stay for some time yet.
