This article was written exclusively for Investing.com
Gold has soared in 2020, rising by more than 25% to historic highs. But it isn’t just the price of the metal that has been climbing. The gold miners have increased at an even faster pace, as measured by the VanEck Vectors Gold Miners ETF (NYSE:GDX) and are up almost 38% on the year. Some traders are even betting that the recent surge in the GDX has only started and could rise further.
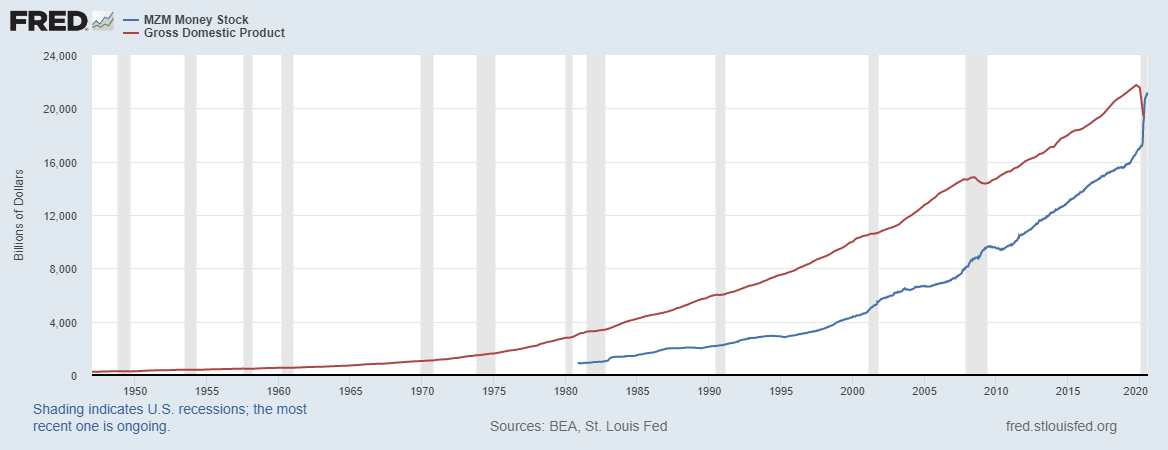
Despite the optimism, gold itself has been coming under pressure recently, as inflation data from the producer price index and the consumer price index are running at very low levels. At the same time, the velocity of MZM fell below one, for the first time, because of the second quarter GDP contraction. It means that gold miners themselves could be in trouble should inflation not show its head, sinking gold even further.
Betting On More Gains
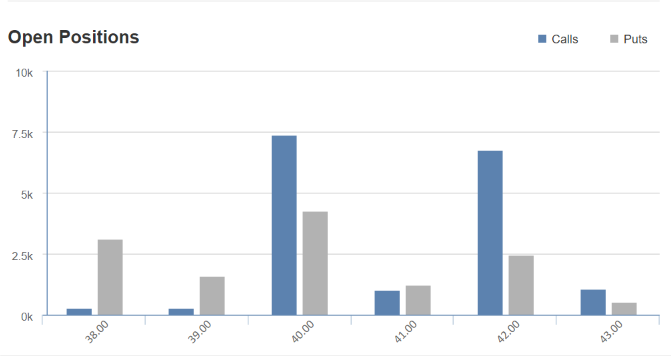
The $42 call GDX options for expiration on October 16 have seen their open interest levels rise during the past few trading sessions, increasing to roughly 6,700 open contracts as of Aug. 12 from approximately 1,000 contracts on Aug. 4. A significant portion of the calls were bought and traded on the ask for around $2.20 per contract on Aug. 11.
It means that a trader would need the price of the GDX ETF to rise to approximately $44.20 to earn a profit if holding the contracts until the expiration date. A gain of about 9% from its price on August 13.
Also, on August 12, the open interest levels for October 16, $35 puts climbed by around 5,600 contracts. The data shows that these puts were sold for about $1.40. It is a bet that the value of the GDX doesn’t fall below $35 by the expiration date.

Source: Investing.com
Technical Weakness
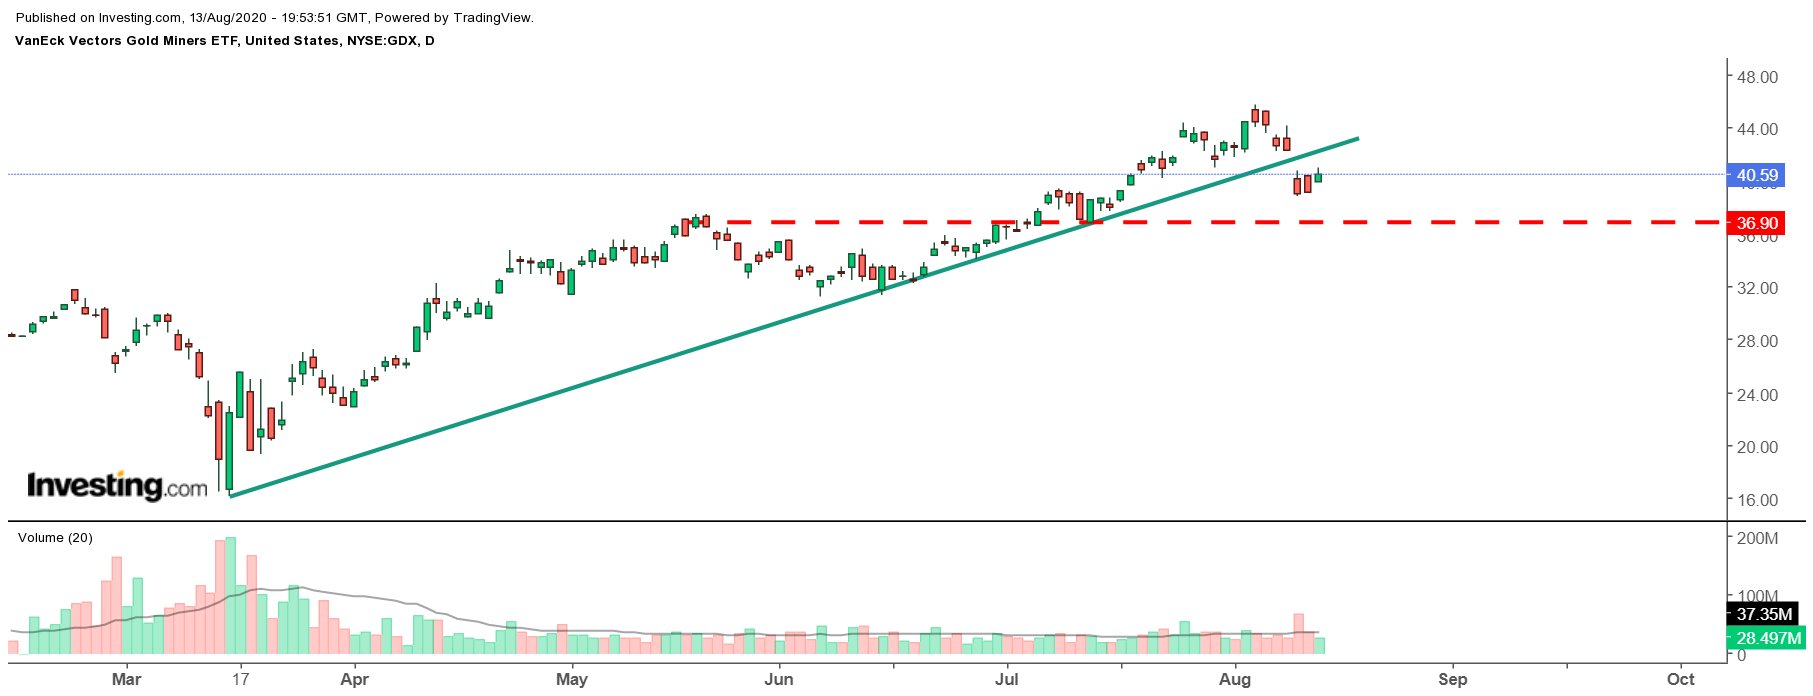
But technically, the GDX appears to be breaking down, falling below a critical uptrend around $41. It could even result in the ETF falling back to its next significant level of support around $37.

It may not matter what the charts say, because the miners are going to follow the price of the underlying metal carefully, so if gold prices should fall further, then the miners are likely to follow suit. The latest PPI and CPI data showed that inflation rates remain low, with the CPI climbing by just 1% in July versus the same period a year ago, while the PPI fell by 0.4% in July versus last year.
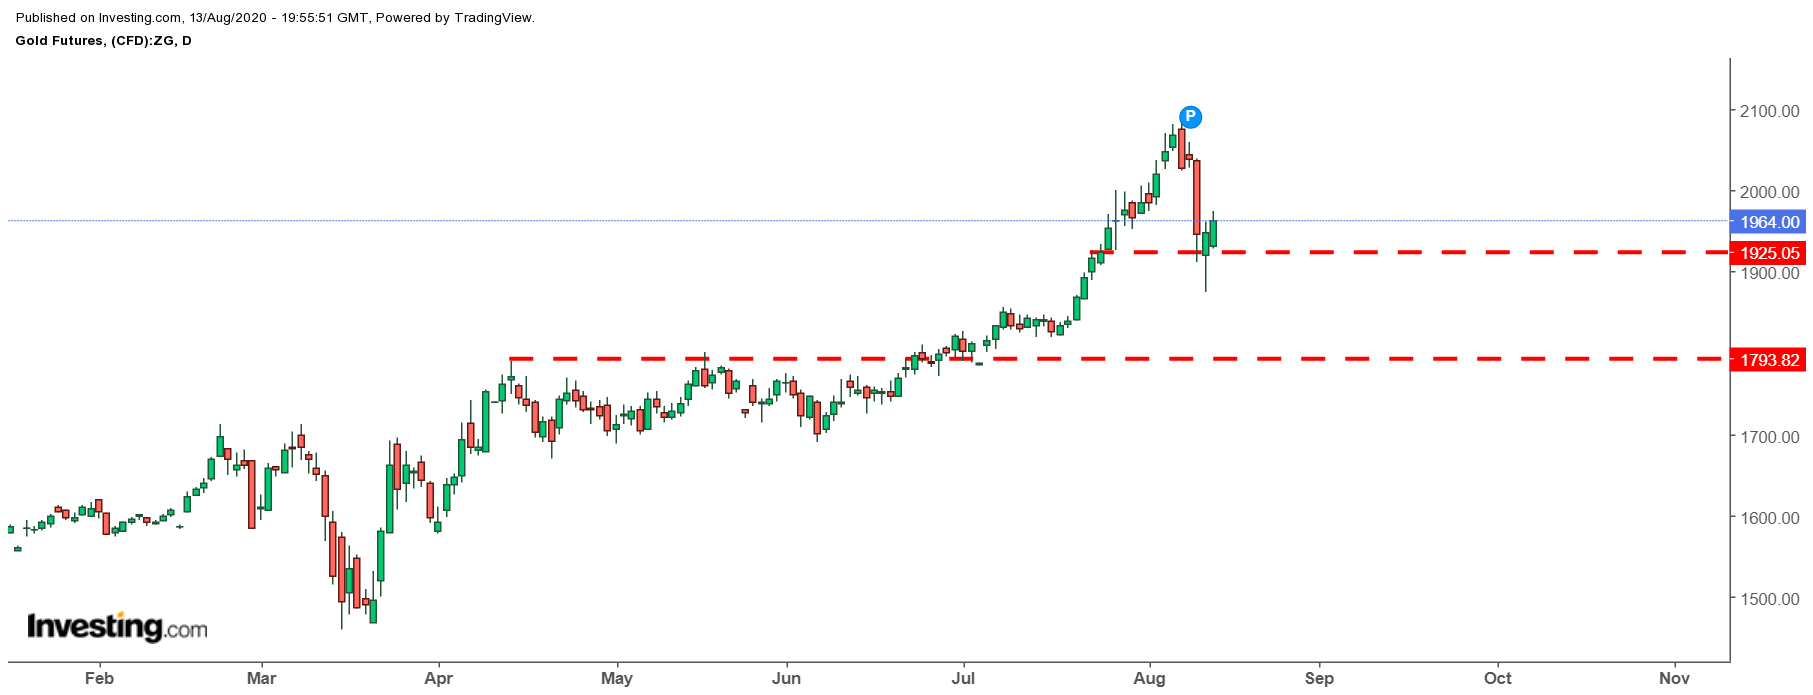
The data points seem to speak against those worried about rising inflation from the easy monetary policy from the Federal Reserve. Following the weak inflation readings, gold prices have plunged by almost 6%. The metal could fall even lower if it cannot manage to hold on to technical support around $1,925. Should that level of support break, the metal could fall to around $1,785.

Money Velocity
Inflation rates may remain low for a long time. The velocity of MZM fell to below 1 for the first time and indicates that there is more money in the system, then the entire nominal GDP of the US economy. This high level of money and declining output is what creates these deflationary forces on the economy. Even if GDP rebounds sharply over the next few quarters, it may not reach the levels needed to push inflation rates higher.

Overall, it could paint a gloomy outlook for gold, and those miners are likely to suffer all the same.
