Fidelity Investments, whose history goes back to the early 1940s, has long been associated with mutual funds. However, in recent years, the group has also increased its exchange-traded funds (ETFs).
The privately-held investment management giant has "assets under administration of $9.5 trillion, including discretionary assets of $3.7 trillion as of Nov. 30, 2020." By comparison, Vanguard, another heavyweight in the fund space, has "about $6.2 trillion in global assets under management, as of Jan. 31, 2020."
We recently covered the Fidelity® MSCI Information Technology Index ETF}} (NYSE:FTEC) and the Fidelity® Total Bond ETF (NYSE:FBND). Today, we introduce two more Fidelity ETFs.
1. Fidelity MSCI Consumer Discretionary Index ETF
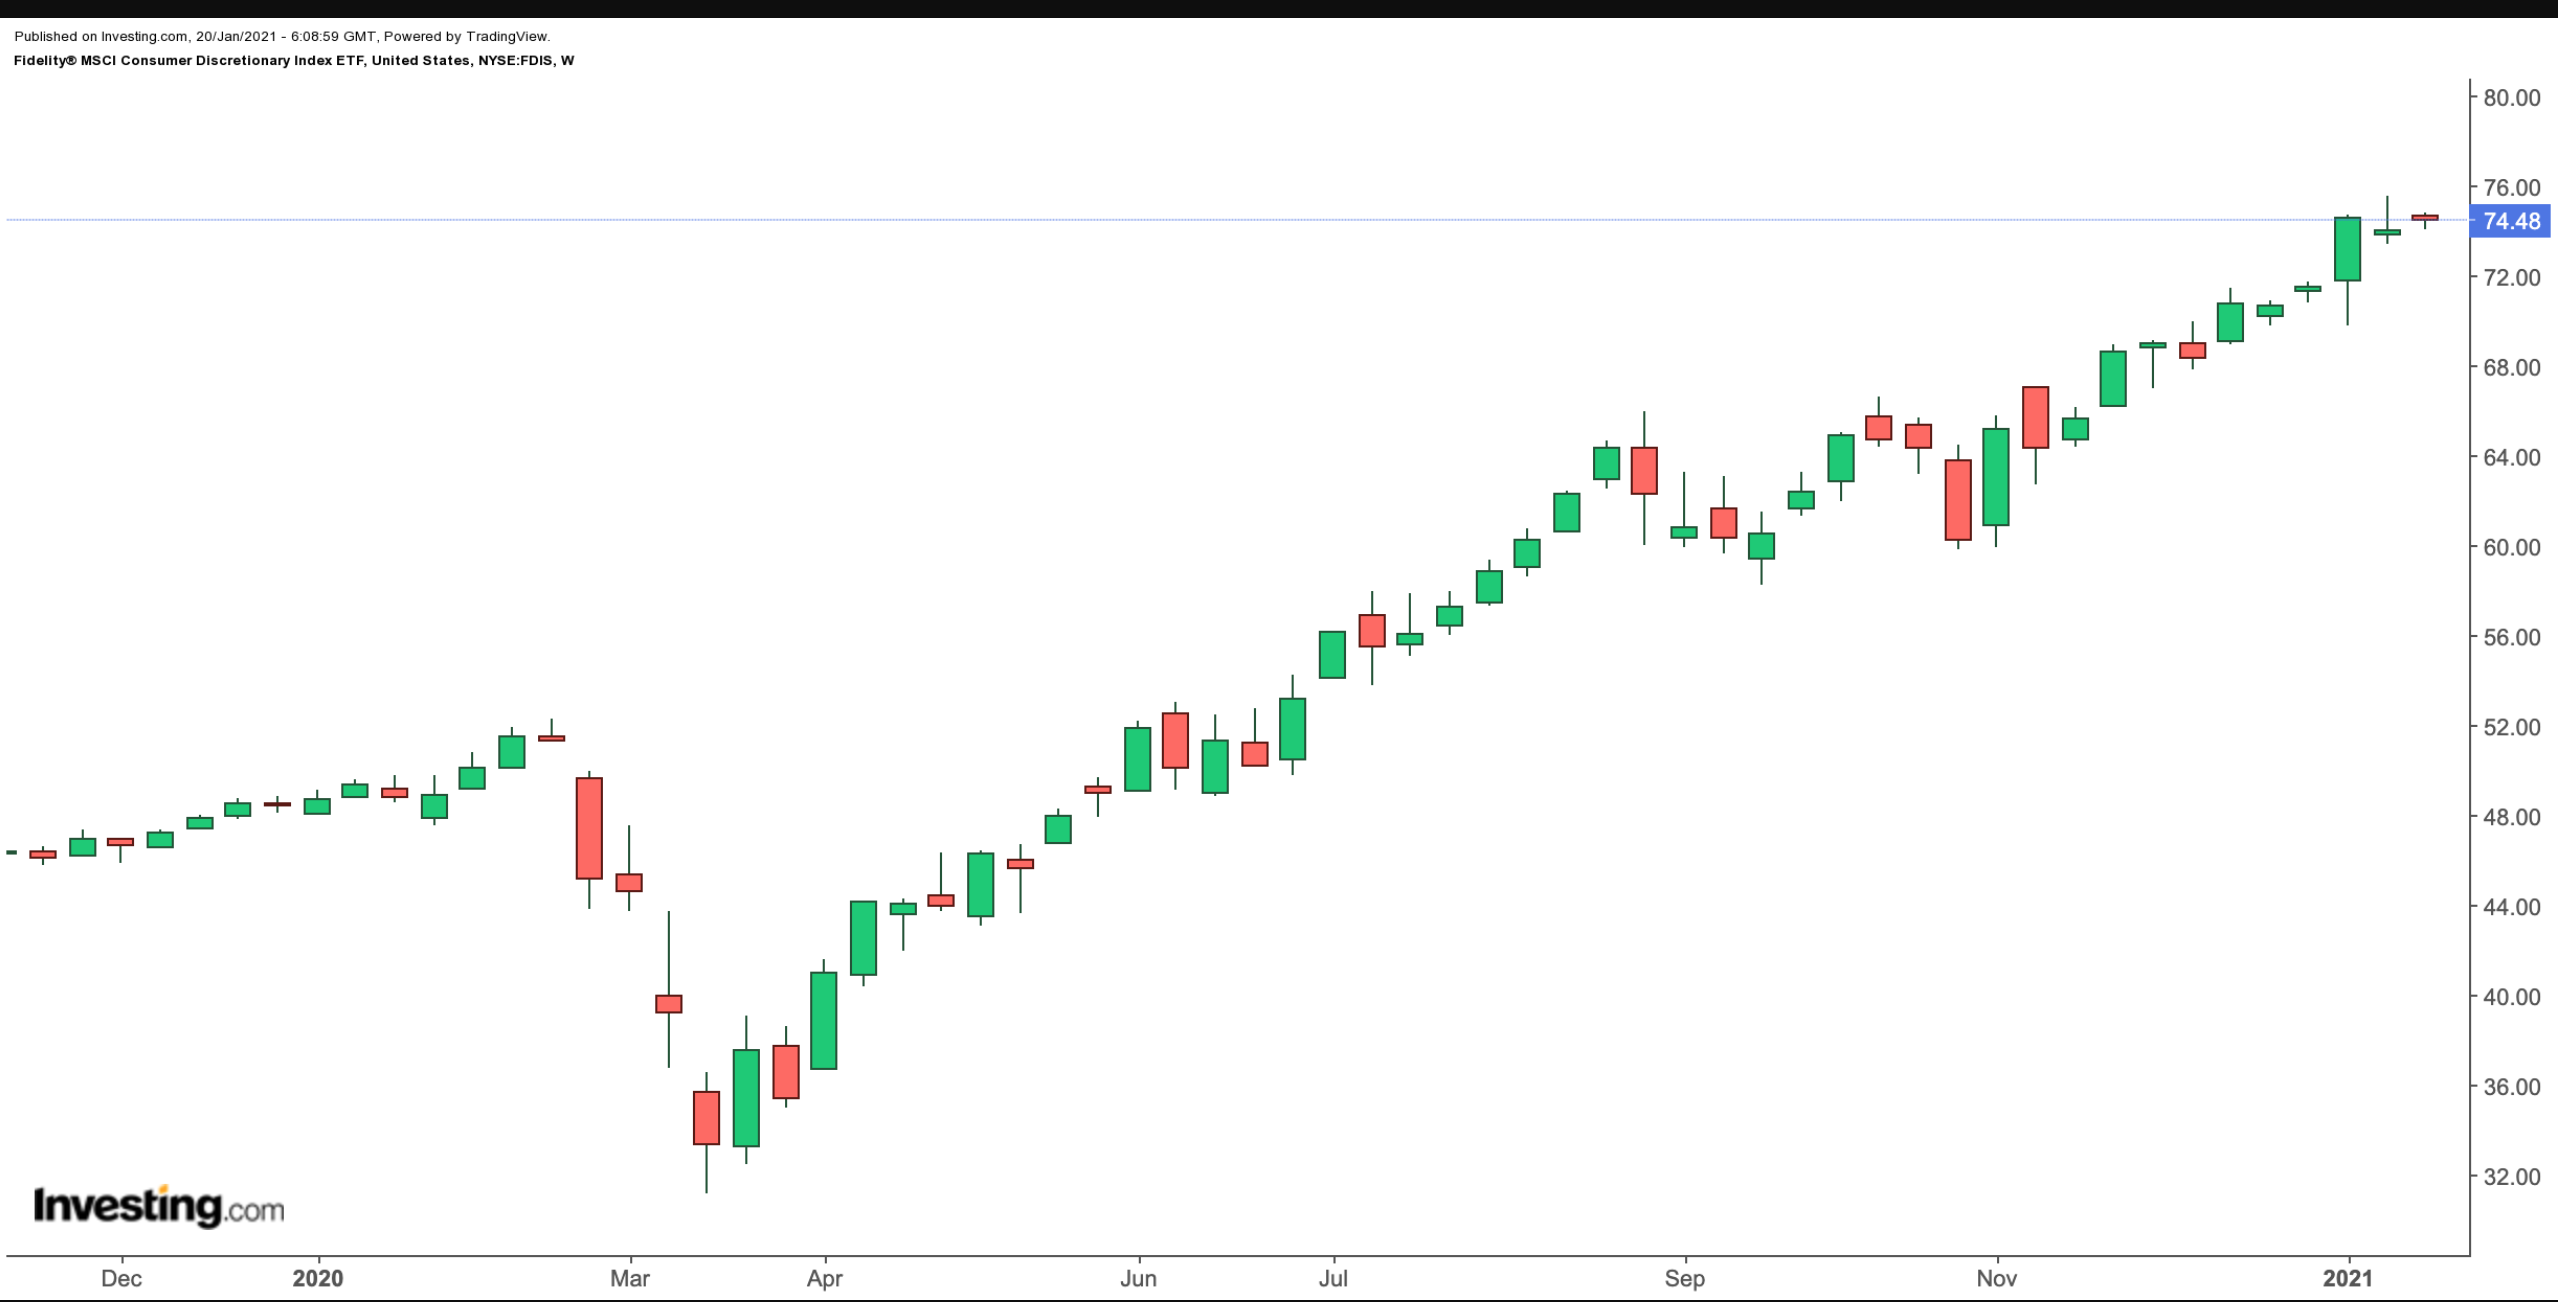
Current Price: $74.48
52-Week Range: $31.21 - $75.52
Dividend Yield: 0.57%
Expense Ratio: 0.08%
The Fidelity® MSCI Consumer Discretionary Index ETF (NYSE:{{941493|FDIS) provides exposure to the U.S. consumer discretionary sector. Firms in the sector typically offer non-essential products and services. In economically challenging times, most consumers would be able to decrease their spending on such discretionary items.

Research by Mostafa Maksy of Kutztown University of Pennsylvania highlights:
"This sector encompasses those industries that tend to be the most sensitive to economic cycles. Its manufacturing segment includes automotive, household durable goods, textiles, and apparel and leisure equipment. The services segment includes hotels, restaurants and other leisure facilities, media production and services."
The performance of the consumer discretionary sector is "closely related to the health of the overall economy; tends to perform well at the beginning of a recovery, when interest rates are low, but can lag during economic slowdowns; offers potential exposure to growth in high-end, luxury brand.”
FDIS, which has 277 holdings, tracks the MSCI USA IMI Consumer Discretionary Index. The fund started trading in October 2013; its net assets are $1.3 billion.
Sectoral breakdown looks like this: Internet & Direct Marketing Retail (29.245), Specialty Retail (18.61%), Hotels, Restaurants & Leisure (15.25%), Automobiles (13.04%), Textiles, Apparel & Luxury Goods (7.23%), Household Durables (4.55%), and others. The top 10 stocks comprise more than 55% of the fund.
Amazon (NASDAQ:AMZN), Tesla (NASDAQ:TSLA), Home Depot (NYSE:HD), Nike (NYSE:NKE) and McDonald's (NYSE:MCD) are the leading names. We should note that the weighting of AMZN and TSLA stocks is 22.81% and 10.81%, respectively. This means that a move, especially in either company's share price, is likely to have a significant effect on the top-heavy fund.
Over the past 52 weeks, FDIS has returned about 51%. Trailing P/E and P/B ratios are 33.59 and 6.91, respectively. Given the run-up in price in recent months, we could see short-term profit-taking in many of the stocks in the fund during the current earnings season. A potential decline toward $70 or below would improve the margin of safety.
Question marks over the economic recovery persist. Yet, consumer discretionary spending is likely to keep gaining ground over time. Therefore, a fund like FDIS deserves further due diligence.
On a final note, the current price supports a dividend yield of less than 0.6%. Thus, for passive income seekers, this would not be an ideal fund.
2. Fidelity Low Volatility Factor ETF
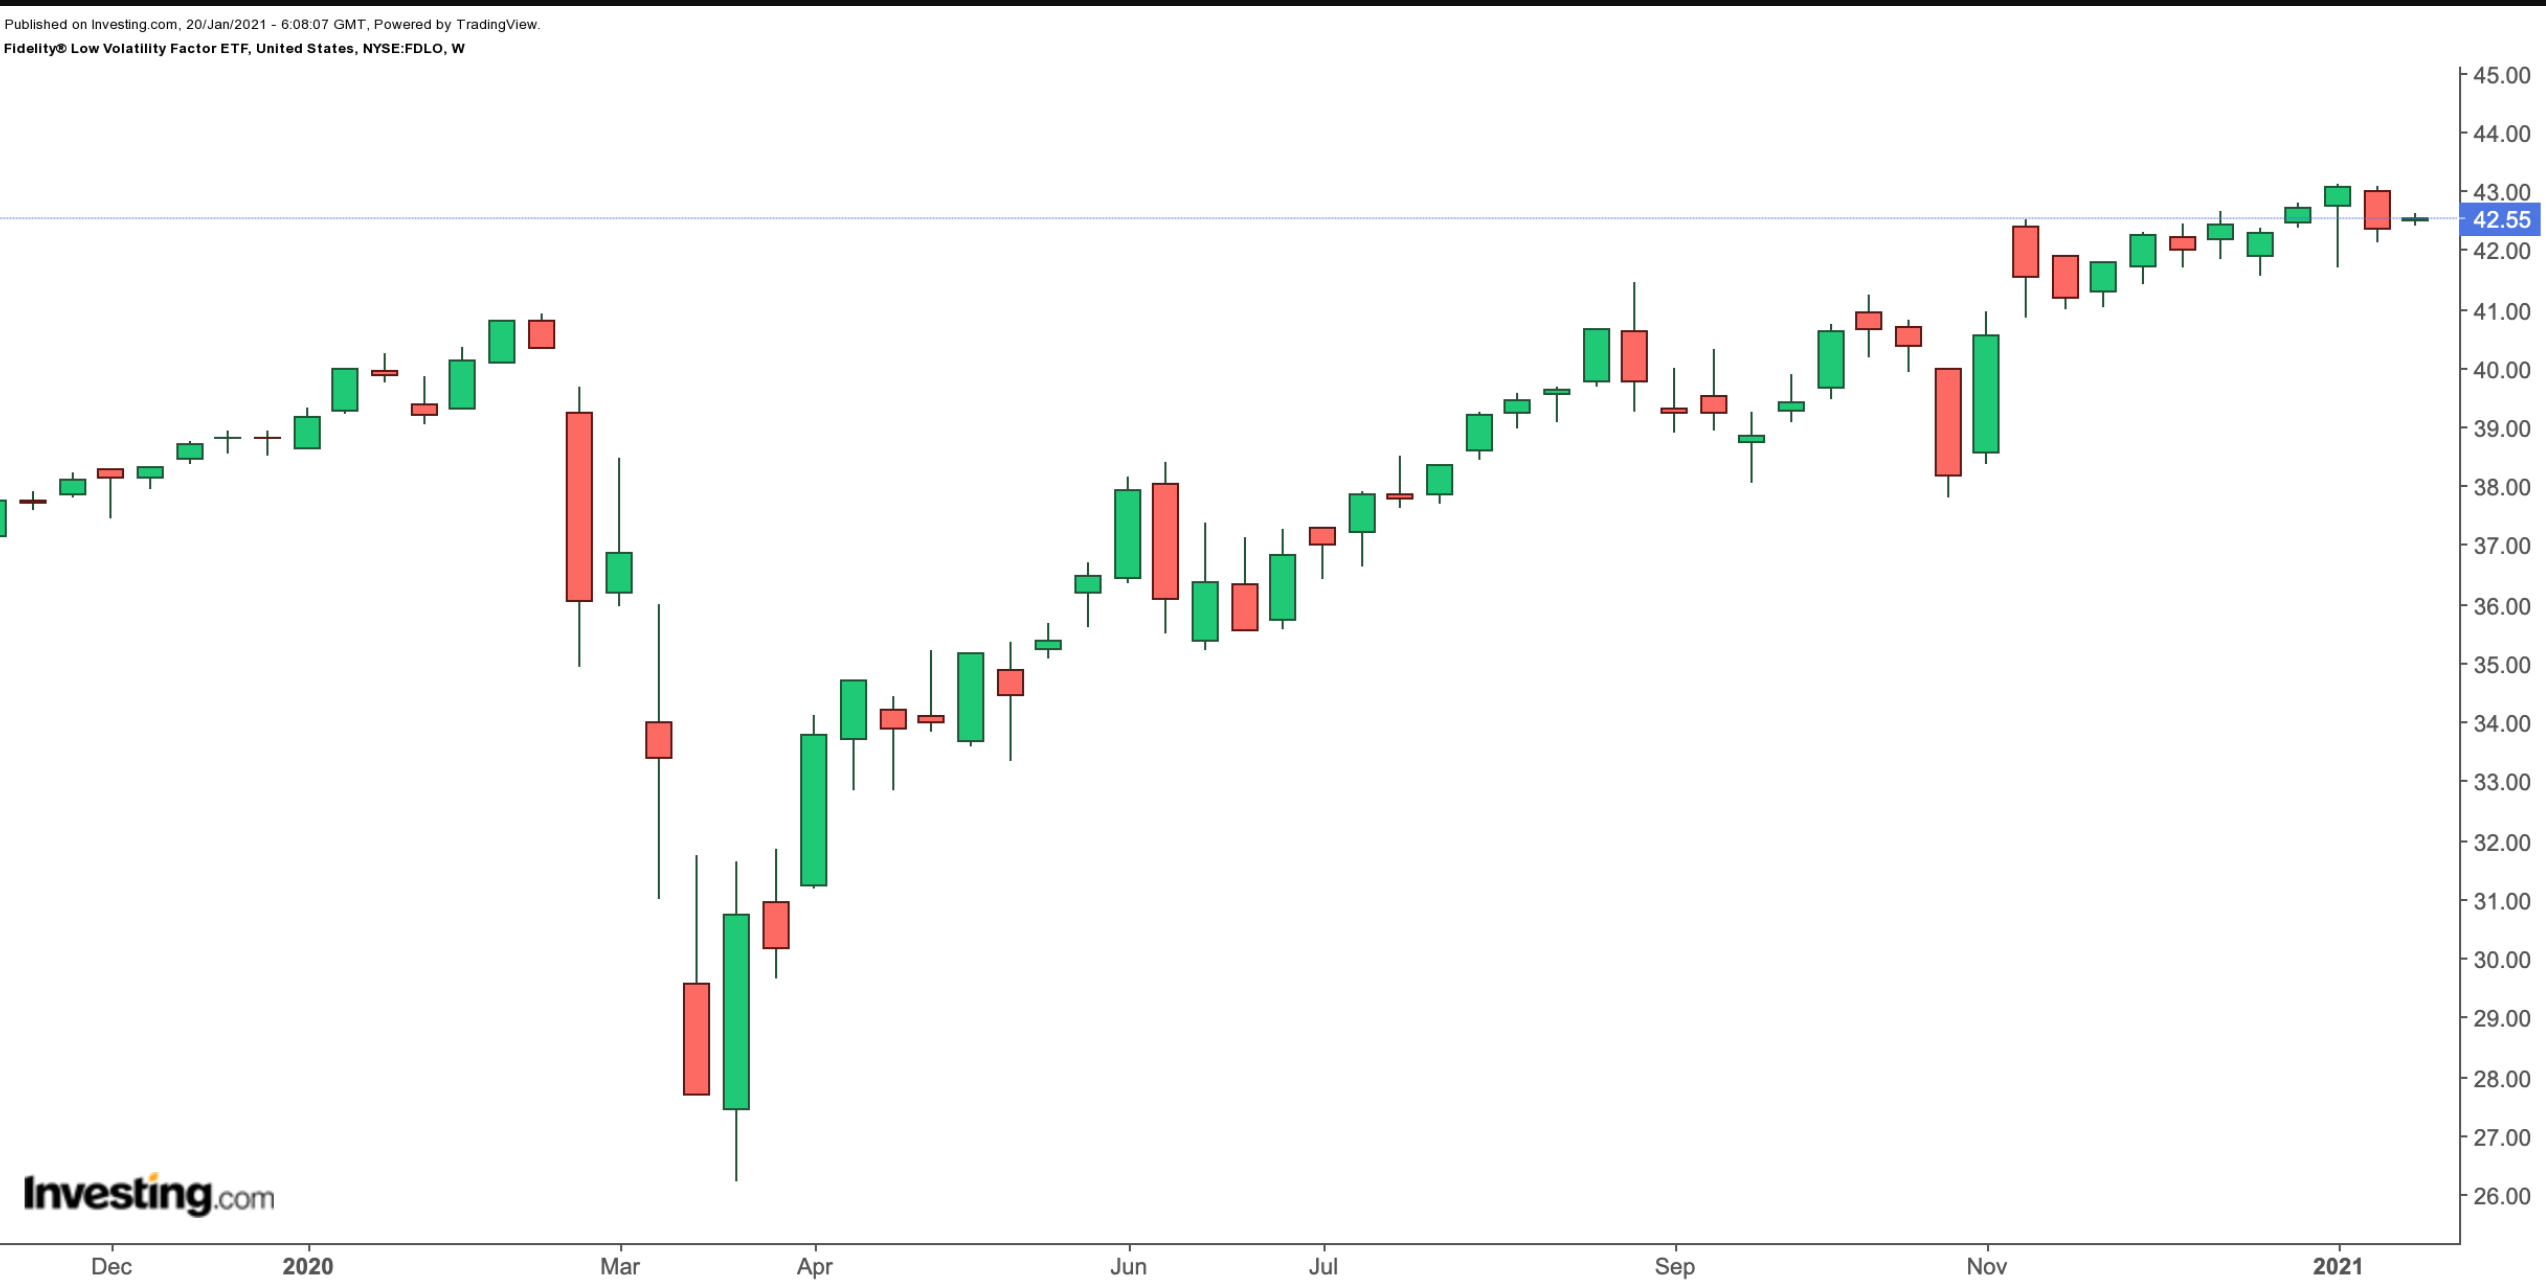
Current Price: $42.55
52-Week Range: $26.22 - $43.10
Dividend Yield: 1.39%
Expense Ratio: 0.29%
The Fidelity® Low Volatility Factor ETF (NYSE:FDLO) gives exposure to large- and mid-capitalization U.S. companies with lower volatility than the broader market.

We discussed the concept of volatility}} in previous articles, which is closely related to the expectations of risk and return. Therefore, low volatility funds could, in part, be appropriate for investors who do not want stomach-churning moves, especially in the short-run. Earlier in January, we introduced two other ETFs that could also be appropriate for investors, especially in this earnings season.
FDLO, which has 130 stocks, tracks the Fidelity U.S. Low Volatility Factor Index. Since its inception in September 2016, assets under management have grown to $398 million.
Microsoft (NASDAQ:MSFT), Alphabet (NASDAQ:GOOG) (NASDAQ:GOOGL), Visa (NYSE:V), Mastercard (NYSE:MA), Johnson & Johnson (NYSE:{{8177|JNJ) are among the leading names. About 23% of assets are in the top 10 stocks.
The ETF is up more than 6% in the past year. Trailing P/E and P/B ratios stand at 27.48 and 4.56, respectively. Buy-and-hold investors could regard a drop toward $40 as a better opportunity to invest in FDLO.
