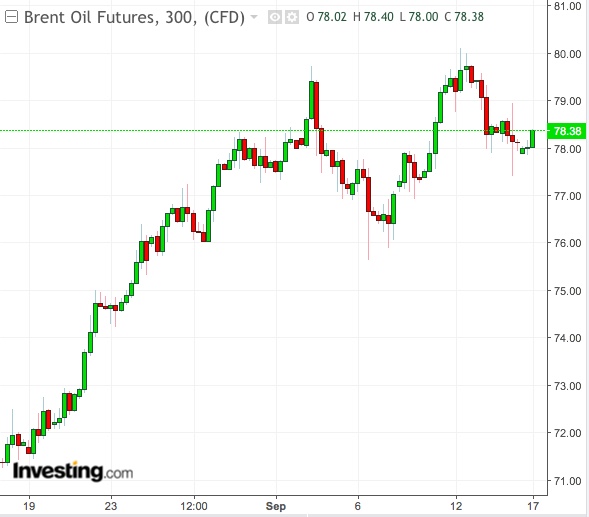
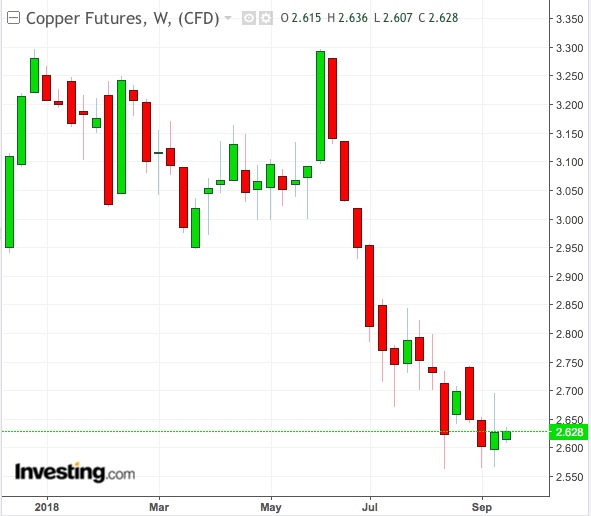
US crude is likely to be trapped in a range under $70 a barrel this week as fears over Iranian oil supplies face off with uncertainties over global demand. Elsewhere, agricultural commodities from soybeans to cotton and hog prices might experience heightened volatility from the impact of Hurricane Florence while copper could be left writhing from new US duties on Chinese goods.
A dearth of economic data on the calendar might also leave forex players with few leads other than the US-Sino trade war, which has so far played to the dollar’s strength and translated to weak prices for commodities—given China’s gigantic demand for raw materials. Gold in particular could weaken if the dollar rallies.
In its latest trade battle with Beijing, the Trump Administration is said to be mulling a 10 percent tariff hike on another $200 billion of Chinese goods, versus an originally proposed 25 percent. But even with the reduced quantum, Chinese negotiators might still walk away from trade talks, the Wall Street Journal reported.
Storm Swings For Ag Prices
As for Hurricane Florence, which made landfall in the US Carolinas last week, the death toll being reported at time of writing is at least 18, with dozens of communities devastated. But the storm’s full impact on commodities isn’t known yet, with divergent views so far on what the outcome could be.
US lean hog prices ran up on Friday in anticipation of pig farm disasters from the hurricane. But natural gas prices could soften, traders said, if rains brought by the storm stifle late summer heat in the Carolinas, resulting in less air-conditioning and power demand for utilities in the region.
To insulate themselves from undue price swings, some investors might double down on futures of crops that have outperformed this year, such as wheat, cocoa and orange juice—which are all in supply deficit after droughts in Europe, strife in West Africa and weak growing conditions in Florida, respectively.
Iran Rhetoric vs Bearish Oil Data
In US West Texas Intermediate (WTI) crude, the trading upside will likely be $70. UK Brent crude could, meanwhile, reattempt last week’s $80 high on Iranian supply worries.

“The volatility in the market is just killing people,” Scott Shelton, an oil broker for ICAP) in Durham, North Carolina wrote on Friday as both WTI and Brent reacted to the push and pull of the rhetoric over Iran versus bearish global oil data.
Data last week from the US Energy Information Administration, the Vienna-based Organization of the Petroleum Exporting Countries and the Paris-centered International Energy Agency all projected less demand growth for oil than previously forecast.
“The caution flag is flying that the global economy could also slow a bit,” said Dominick Chirichella, director of risk management and trading at the DTN-owned Energy Management in New York.
Even so, fears about a total freeze in Iranian oil exports beginning November 3 is providing strong support to crude prices, some say.
For weeks, the oil market has shifted between the two narratives: the first is that prices could hit $100 per barrel or more once US sanctions against Tehran reach their full potential. The other is that WTI might tank to $60 or below if the shortfall in Iranian supplies are covered by additional US shale and OPEC pumping, and demand for oil at large begins to wither due to the US-Sino trade war.
Investing.com’s daily technical outlook has a “Sell” on WTI, with Fibonacci patterns indicating support could drop to as low as $66.98, versus Friday’s settlement of $68.99.
For Brent, a “Strong Buy” is recommended, with the hardest resistance seen emerging at $80.43 onward, versus last week’s peak of $80.13.
“Strong Sell” Call In Copper
In copper, Investing.com’s daily technicals call for a “Strong Sell”, with Fibonacci Level 3 support dropping to as low as $2.6000 per lb—indicating a potential loss of nearly 5 cents from Friday’s settlement of $2.6460.
Money managers added aggressively to their net bearish position in New York-traded copper last week on the prospect that US exports of the metal in scrap form to China might cost more under new tariffs that could hamper demand for the commodity.

The net short in US copper held by hedge funds and other large speculators was 8,894 contracts during the week to September 18, versus 5,977 in the previous week to September 11, the US Commodity Futures Trading Commission said on Friday.
“We suspect that any progress on the trade front will take time to materialize, which suggests that traders will continue to shun the red metal's firm fundamentals for the moment,” TD Securities said in a note at the weekend.
