Energy markets, along with precious and industrial metals, will likely see tight trading ranges this week ahead of key rate decisions and US jobs data, while agricultural prices could continue creeping higher on inclement weather and falling inventories.
A widely-expected rate hike by the Bank of England (BOE), the possibility for the Bank of Japan (BOJ) to surprise markets with its own rate decision, the potential for the US Federal Reserve to react to President Donald Trump's recent criticism and an anticipated third monthly jump in US employment are on the calendar. Together, these will determine the direction for the dollar and investors, caught in the crosscurrents of global macro and supply-demand factors for oil, gold and copper.
In crop markets, it will be a more straight-forward play of weather extremities, with ongoing droughts in Australia and parts of Europe expected to keep wheat on a bullish tilt. Dry conditions are also threatening cotton plantings in China and sugar fields in Brazil and India.
The Bloomberg Commodity Index, a measure of 26 raw materials, settled up 1.4% last week for its biggest weekly gain in 3-1/2 months. The index surged after crude oil prices fell on Friday but rose for the week on supply fears associated with US-Iran rhetoric and Saudi Arabia’s decision to suspend shipments through a Middle East channel. Copper rallied too, on an impending labor strike at Chile’s Escondida mine.
Dollar Bears Could Rise Again
A further retreat in the dollar from one-year highs could help industrial commodities advance this week. Many are betting on this if the BOE proceeds with its forecast 25-basis point hike, and the BOJ decides to contract instead of ease. Another bearish outcome for USD will be if US non-farm payrolls for July comes in below the forecast growth of 190,000.
“Investors bought the dollar on expectations they will see at least two more rate hikes before the year is out,” said Fawad Razaqzada, currency analyst at forex.com.
“However, after a three-month rally, some market participants have wondered how much of the bullishness is already priced in,” Razaqzada said, arguing that even the 4.1% US GDP Q2 growth that came in on Friday couldn’t rally the buck. Investing.com’s daily technicals call for a “Sell” in the dollar.
US Inventories, China Demand Key To Oil

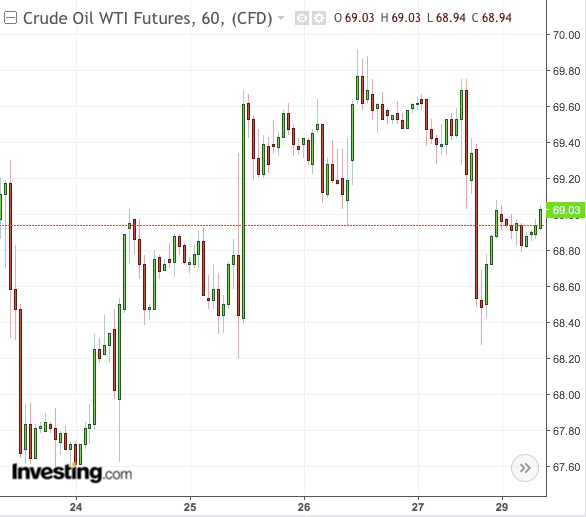
A weaker dollar aside, oil bulls will be counting on another large drawdown in US storage numbers on Wednesday. Last week’s 6.1 million-barrel decline was more than double the forecast, erasing the previous week’s buildup of 5.8 million.
With only about six weeks of peak summer driving left in the US, crude consumption has turned volatile, leaving the proponents for higher oil prices to place their faith in domestic crude exports. With Washington and Beijing still struggling to find common ground in their trade war, the spotlight has fallen on the flow of about 400,000 barrels per day of US crude to China.
“US barrels may struggle to find alternative homes if Chinese appetite weans (particularly if sanctioned Iranian crudes muscle into China in larger size),” RBC Capital Markets wrote in its weekly outlook.
“The natural assumption would be that the US re-routes to Europe. Europe is a large consumer of US oil, but the competition among light, sweet barrels is fierce. This is highlighted by similar grades like North Sea and West African barrels that are currently struggling to find placement in a contango-ridden Brent market.”
West Texas Intermediate (WTI) crude settled at $68.69 a barrel in New York last week after reaching the $68.30 support that broke the bullish trendline. Investing.com’s daily technicals have a “Buy” on WTI. UK Brent crude, which settled at $74.29 per barrel, also has a “Strong Buy” call.
Gold Under Pressure; Escondida To Boost Copper

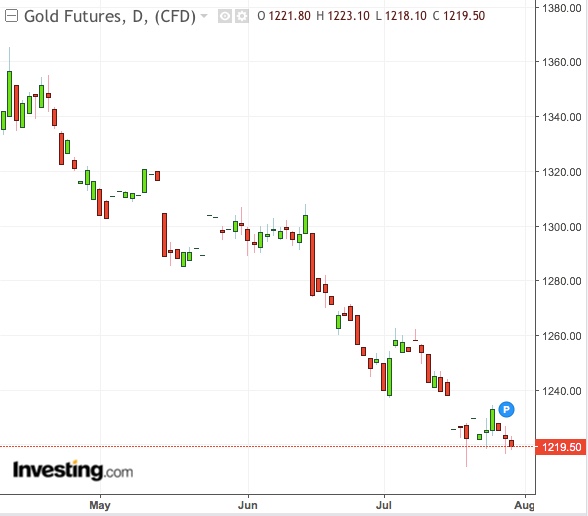
Notwithstanding further dollar pressure, gold’s trendline is likely to stay bearish, with support for the yellow metal as an inflation hedge dissipating, say some analysts.
“Traders are still not seeking havens in gold, and the dollar is holding strength at over 94.50 on the index,” George Gero, precious metals tracker at RBC, said in a pre-weekend note. “All this keeps gold on the defensive for now, and the large continued open interest in options with large puts below key $1,200 (per ounce) may continue volatility all through this quarter. “
Gold futures, which settled last week at $1,222.20 per ounce in New York, are viewed as “Strong Sell” on investing.com’s daily technicals.
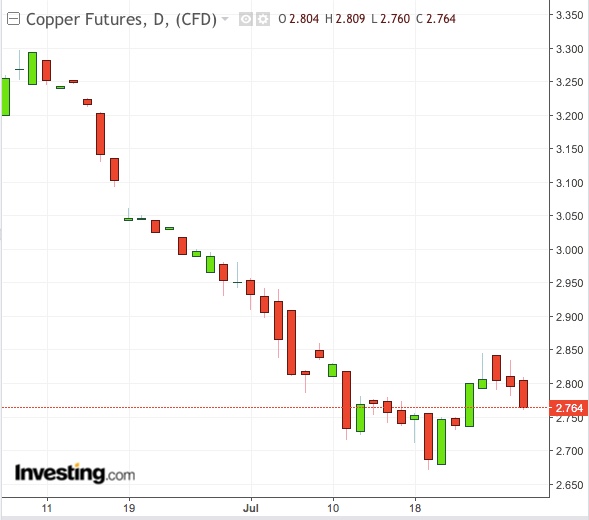
In copper, money managers’ bullish net positions in New York-traded futures of the red metal advanced for the first time in six weeks during the week to July 24, data from the US Commodity Futures Trading Commission showed.
Copper has been in favorable light since a breakdown in contract negotiations between the union and management at BHP’s Escondida mine. Settling last week at $2.796 a pound in New York, copper is deemed “Strong Sell” on investing.com’s daily technicals.

