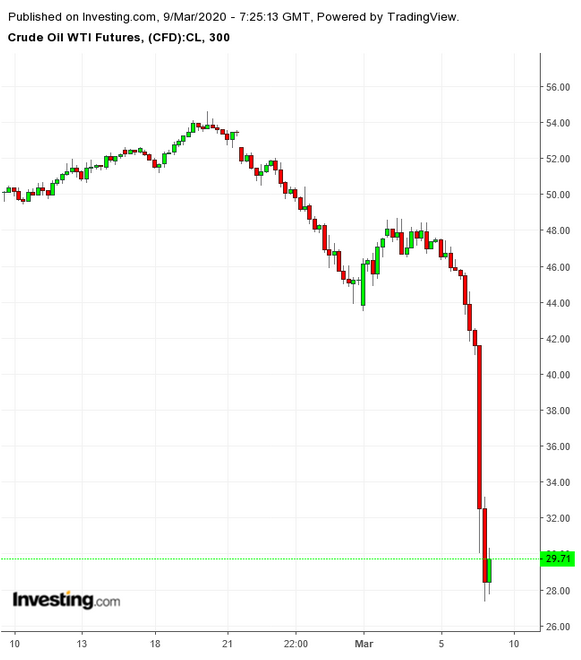
Even before the latest Goldman Sachs note on oil, hedge funds had $30 per barrel in their sights, even a $20 eventuality, after Friday’s disintegration of OPEC+. With Wall Street’s leading voice in energy now affirming their call, crude is looking at an “anything likely” bottom as the coronavirus stalks whatever’s left of the globe.

The tough part, however, is figuring out what the near-term bottom will be, and where the carnage will stop this week. The monthly oil supply-demand outlook from the International Energy Agency later today, and from OPEC, or the Organization of the Petroleum Exporting Countries, on Wednesday could help the market decide.
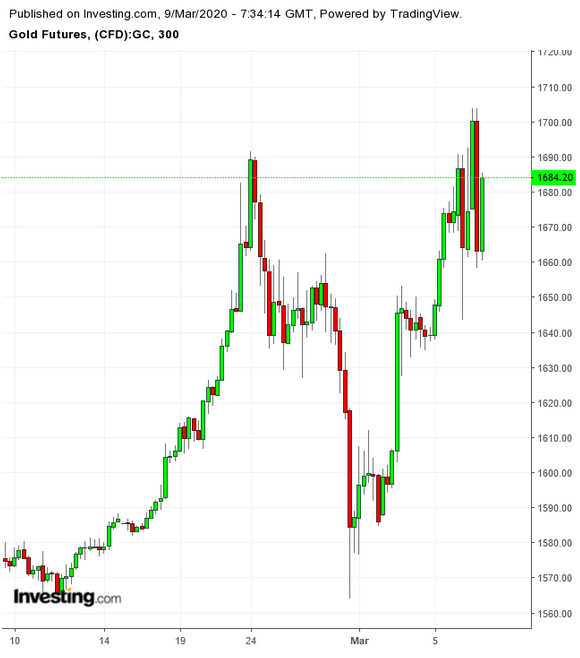
For gold, picking a target seems a lot easier, though getting there might be difficult too. With the yellow metal finally piercing the $1,700 per ounce resistance in early Asian trade on Monday, the next logical targets are $1,750 and $1,800.

Yet, with gold being one of the most liquid of assets and a true friend in times of political and economic troubles, one can expect it to be sold as well to cover losses in oil, equities and elsewhere.
Logical, Yet Complicated, Targets
“Gold's hold on the $1,700 level looks tenuous for now, and we wouldn't be surprised if it retreats slightly from these levels with stop-loss buying not noticeable at these heights,” said Jeffrey Halley, senior market analyst at online trading platform OANDA. “That said any drift lower to $1,695.00 an ounce is likely to be met with plenty of willing buyers.”
With oil, first things first: For U.S. West Texas Intermediate, or WTI, to reach $20 levels, oil bears will have to take out a $26.05 bottom from February 2016. That was a low before the restraint set by OPEC+, when the Saudis, Russians and U.S. shale drillers were all pumping oil like there was no tomorrow — an unbelievable situation that could occur again.
If WTI capitulates anytime this week to break $26.05, the next test isn’t too far at $25.42. But the milestone it sets could have a huge impact on market psyche as that $25.42 would be a near 17-low year stretching back to May 2003.
If $25.42 gets broken too, the next hurdle will be $24.82 from November 2002 — marking a near 17-½ year low.

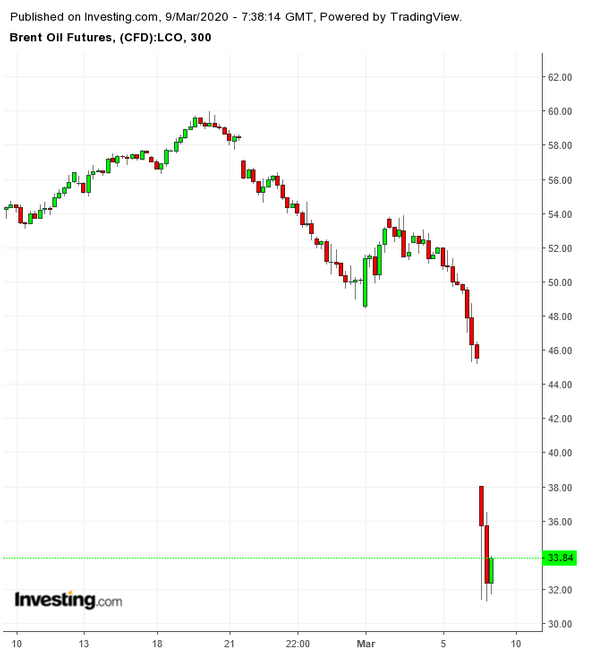
For U.K. Brent crude, at the time of writing, the two immediate support levels holding up were $29.92, set in February 2016 and $27.10 in January 2016. Pass that, and you are looking at a test next at $26.97 from November 2003.
Even at those lows for WTI and Brent, we haven’t gotten anywhere near to the base $20 that Goldman spoke about.
The last time oil was at or below $20 a barrel was in February 2002 — 18 years ago — when WTI hit a low of $19.09 and Brent a bottom of $18.80.
“Revenge Of The New Oil Order”
“If we get to $20, many of today’s younger oil traders would never have seen such live prices on the screen before them,” said Tariq Zahir, managing member at Tyche Capital Advisors, a hedge fund in Long Island, New York, that runs a global macro commodities program focused largely on crude.
“To this younger lot, this will be completely charted territory, meaning they’ve only seen such prices on the charts.”
Goldman’s “Revenge of the New Oil Order” note — a reference to the oncoming Saudi-Russian oil production and price war, with reluctant U.S. shale drillers caught between — said the current prognosis for crude is even more dire than in November 2014, when the last such battle occured.
According to the Wall Street bank, the only parallels it could draw with the present situation was during the demand shock for oil in the first quarter of 2019, which came after the financial crisis, and the mid-2015 production surge by OPEC, which preceded the 2016 OPEC+ truce between Riyadh and Moscow.
But even as Goldman speculated on “operational stress levels and well-head cash costs near $20 a barrel,” it conceded that the twin bearish shocks of optimum production-price cuts and demand destruction means “there is so much that we still don’t know about (on) oil fundamentals in coming months.”
Using the 2016 sample of a bear market for oil, it concluded that the worst impact on price from maximum inventory builds will occur over the next six months, meaning $20 lows could occur by the third quarter, before a recovery to the higher $30s and $40s.
A Situation That’s “Beyond Risk-Off”
But a tumbling Wall Street and massive worldwide city lock-downs — seen first in China, now Italy and possibly the United States later — could force $20 oil way before the timeline suggested by Goldman.
“What’s happening now is beyond risk-off,” Zahir said. “I wouldn’t be surprised if you get to $20 very quickly, especially if you get to a bear market on the S&P 500. U.S. consumers are definitely going to take a big hit from this and they form the biggest part of the U.S. economy. Until you start to get some clarity on the total threat to the U.S. economy from the virus, Wall Street cannot quantify how much hurt this is going to cause.”
He adds:
“In my opinion, there’s not going to be a V-shape recovery. You have a chance of this getting a lot worse before it gets better. Right now, any bounce I see in any risk asset, especially oil, I’m selling into. I’m only long bonds on my global macro program and long gold.”
Halley, the analyst at OANDA, has a similar outlook. “For today, however, we may have seen the worst of the oil sell-off in the near-term,” he said, referring to the $27.34 low for WTI and $31.27 for Brent in late afternoon Singapore trade.
“That said, any rallies from here are likely to be met with walls of sellers, and it is hard to envision Brent crude back above $40.00 a barrel in the next few months.”
