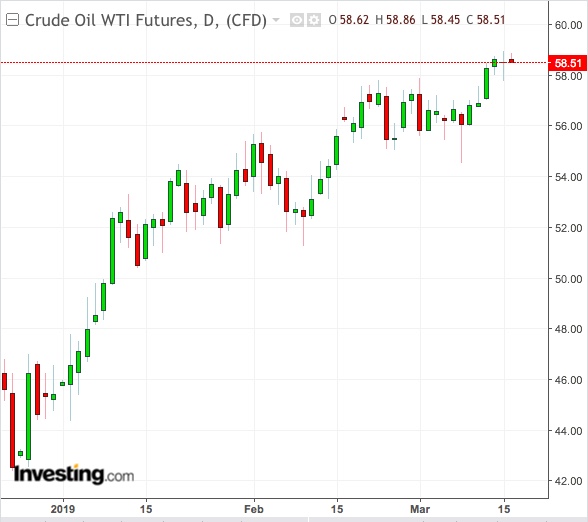
Cuts, cuts and more cuts—that’s what the oil market is likely to hear of between now and OPEC’s next meeting, with data showing the world still has more crude than it needs and $80 per barrel remaining a wishful Saudi target despite 1.2 million barrels per day—or more—of supply being taken out.
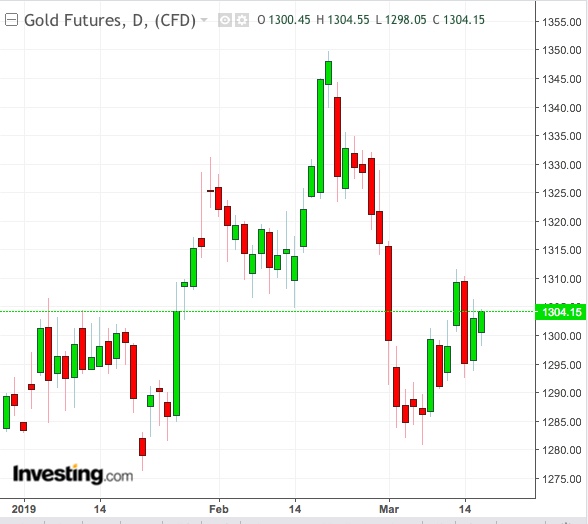
Gold, on the other end, seems to have its work cut out for a steadier $1,300-an-ounce footing as global economic worries alternate with the Brexit crisis in propping the yellow metal up as a safe haven.
OPEC Oil Cuts To Continue Till June
After production cuts since the start of the year, energy ministers from the 15-member OPEC group and from the Russia-led alliance of ten called OPEC+ hunkered down in Baku, Azerbaijan, to tell the market three things this past weekend: that there was still too much oil in the world and cuts will likely have to continue till June; that uncertainties over Iranian and Venezuelan supplies were complicating market rebalancing; and last but not least, that cuts above 1.2 million bpd may be needed and the Saudis won’t be the only ones carrying that burden.
OPEC is also thinking whether to scrap a production review meeting scheduled in April and go straight to its more important policy conference in June, since it won't be done cutting output by next month anyway. That means the market could be hearing what ANZ Bank called at the weekend more OPEC "noise" on cuts till June.
Dominick Chirichella, director of risk and trading at the Energy Management Institute in New York, said in a note issued at the weekend:
“The supply cut narrative has outpaced the potential slowdown in global demand scenario for the last few weeks, keeping the oil bears on the sidelines.”

In market context, that means OPEC’s mantra will likely prevent crude prices from retreating significantly until oil bulls achieve their near-term target of $60 for WTI and $70 for Brent—despite the cartel’s admission that its quest for a balanced market was easier said than done. The OPEC stance is even more remarkable if it factors in the possibility that U.S. crude production may actually be falling, according to data released last week.
Too Much Supply Or Too Little Demand?
But the oversupply in oil—or rather, the underwhelming demand for crude, depending on how one looks at it—isn’t just conjecture by OPEC or authorities such as the U.S. Energy Information Administration and the Paris-based International Energy Agency.
Orbital Insight, a Palo Alto, California company that monitors global crude supply with laser-like precision using satellites to study the rooftops of 25,000 oil tanks, noted a build of 84.3 million bpd in the market over the past year, despite the OPEC cuts. Some 66 million bpd of that build, or 78%, was in China, which is grappling with its worst economy in three decades.
While it wasn’t surprising to find builds in the United States too, given that its abundant shale oil was what upended the market, there was supply growth in the OPEC countries as well—the so-called “production cutters.” And the U.S. holds the keys to production in two of OPEC’s most important members—Iran and Venezuela—via sanctions, giving the Trump administration, which wants lower oil prices, the advantage of surprising the cartel at any time with unexpected decisions.
According to the Orbital data, the only group of countries with a year-on-year decline in oil stocks was the OECD, which accounts for the world’s richest nations. But with European economies making up more than two-thirds of this group, and after factoring in the slowdown in that region over the past year, it would be logical to conclude the drop was due to lower imports of crude rather than consumption overtaking supply.
U.S. Economy Not Supportive
All of which raises the question: how well supported is this year’s near-30% rally in oil, from a fundamentals point of view? From the perspective of the U.S. economy—which, in the footsteps of Europe and China, is sounding its own weak warnings now—the answer: “not very.”
The measure for U.S. first-quarter GDP is looking very weak, with the Atlanta Federal Reserve projecting a real annual growth of just 0.4%.
Analysts at Morgan Stanley said last week that investors should brace for a U.S. earnings recession, after labor market growth virtually came to a halt in February.
U.S. mortgage rates have also swung to the lowest levels in a year, with the clouds over the housing industry—the cornerstone of the country’s economy—unlikely to clear anytime soon.
The only thing the U.S. has going for it is the Federal Reserve’s promise that it will be patient with rate hikes—giving equities on Wall Street, which often lead oil—the chance to rally despite a troubled economy.
Gold May Now Have Stronger $1,300 Perch

In gold, U.S. futures, as well as globally-traded bullion, returned to the key $1,300 perch on Friday on a suggestion by China’s Premier Li Keqiang that there could be more pressure on the economy amid weakening U.S. manufacturing and employment data.
Walter Pehowich, executive vice-president at Dillon Gage Metals in Addison, Texas, said the drop in New York’s Empire State manufacturing index to below 10 for the third consecutive month in March is a major booster for gold.
Investors also turned to the safety offered by the metal after the number of U.S. citizens filing applications for unemployment benefits rose more than expected last week amid a higher-than-forecast drop in new home sales in January.
Said Dillon Gage’s Pehowich:
"We see the price of gold back above $1,300, sparked by a weaker-than-expected Empire State manufacturing survey."
"The yellow metal is teetering at the previous resistance level of $1,304. This seems to be an important level as the market either accelerates or declines, depending on (whether) the trend is up or down from this level."
