Will it be China or OPEC to determine the direction of oil prices? Or, for that matter, will it be China or the Federal Reserve?
As oil and gold prices both enter inflection point after recent highs, the one market player investors across commodities are looking at for clues is China.
Being the largest economy after the United States and the biggest consumer of oil, metals and grains, China virtually has the last word on global raw materials demand.
While such a situation has been a boon to commodities over the past two decades, when Beijing’s economy expanded at an annual average of more than 9%, it’s somewhat a curse now after the trade war with the U.S. over the last year put the country on its slowest growth trajectory in 28 years.

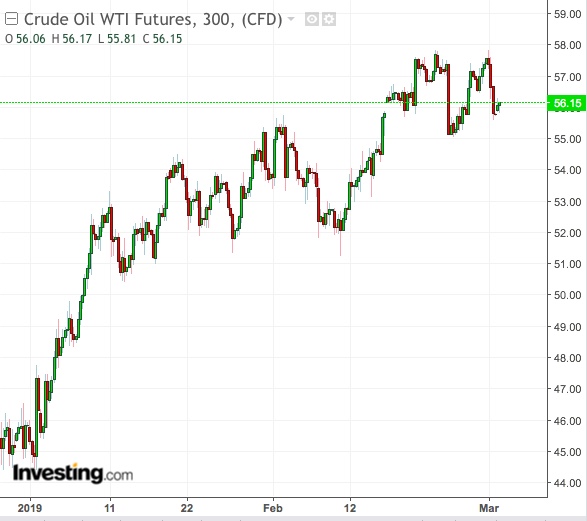
To be sure, oil is having one of its best starts of a year, with benchmark U.S. West Texas Intermediate and U.K. Brent up more than 20% each, reacting to output cuts by the OPEC+ alliance of 25 oil producing countries and supply squeezes caused by U.S. sanctions on Venezuelan and Iranian oil.
The Fed’s assurance that it will be patient with rate hikes, after four increases last year, has also boosted hedge fund money flows into oil.
China Offsetting Bullish OPEC Story
Even so, oil prices experienced their first weekly decline last week, after a four-week rally, as China reported anemic factory data. U.S. Trade Representative Robert Lighthizer added to investor consternation when he reported that the Trump administration was having trouble reaching a trade deal with Beijing.
Despite data showing surprisingly high consumption of crude, gasoline and distillates including diesel in the previous week, worries have grown over oil demand.
The International Energy Agency said that this year the global oil market might struggle to absorb supply from outside OPEC, led by U.S. output, which is expected to hit a world record of 13 million barrels per day before the end of 2020. Demand growth for 2019 is forecast at 1.4 million bpd versus a supply growth of 1.8 million, the EIA said.
Dominick Chirichella, director of risk and trading at the Energy Management Institute in New York, said:
“I believe oil market participants are becoming more and more concerned over the state of the global economy and if in fact a slowdown is on the horizon, that does not bode well for oil demand growth and, thus, higher oil prices.”
Chirichella said the continuous erosion in Chinese manufacturing PMI Index over the past three months and 2-1/2 year lows hit recently in U.S. PMI data were flashpoints for last week’s selloff in oil.
A critical point this week will be whether WTI breaks under $52—an action that could send the market all the way to December lows of $43 per barrel, warns John Kilduff, founding partner at New York energy hedge fund Again Capital.
The U.S. crude benchmark settled on at $55.80 on Friday. Investing.com’s technical analysts have a “Buy” recommendation in their daily outlook, pegging strongest Fibonacci resistance for WTI at $58.73 and support at $54.11.
Kilduff told CNBC Television that slowing global growth, especially in Asia, Saudi Arabia's push for deeper production cuts and rising tensions between India and Pakistan could damage demand for oil in the near-term.
He added:
"The real critical center for crude oil is Asia and Asian demand, and the economic data out of Asia has been quite poor. And I'm not certain that even striking a trade deal with China is going to improve that country's fortunes."
Dollar Trumps Gold As Hedge For U.S-China Troubles
Fears over China were also helping the dollar pull the rug out from under gold.

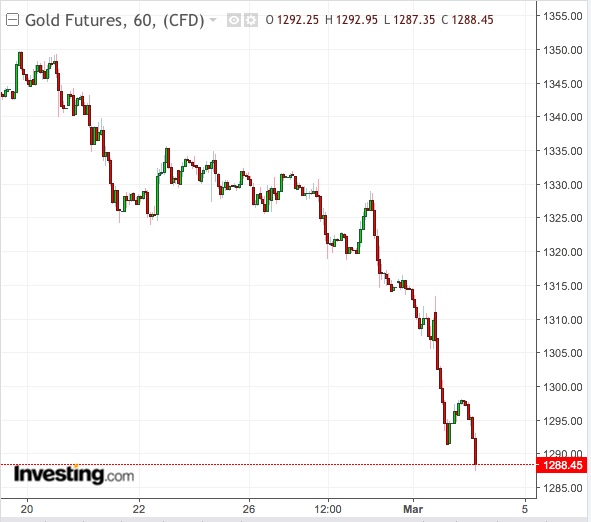
Gold futures on New York’s Comex tumbled 2.5% last week, for their sharpest weekly loss in six months, falling below the key $1,300 level they had held above since Jan. 20. They remained under that perch on Monday, hovering at $1,298 in Asian trade.
Technical analysts on Investing.com have a “Strong Sell” recommendation in their daily outlook on Comex gold, predicting strongest immediate support at $1,291.85.
The gold market’s collapse has stunned bugs, as central banks had been aggressively buying bullion in recent weeks on worries over Brexit and other global troubles.
Conversely, the Dollar Index was steady at 96.33 early on Monday after scaling a two-week peak in the previous session, as the greenback resumed control of its narrative as the best hedge to the U.S.-China conflict. While some have counted on gold as a safe-haven to the trade war, the dollar has held the higher ground here.
Even so, some analysts said the gold slump was overdone and expected a return to $1,300 levels soon.
Walter Pehowich, executive vice-president at Dillon Gage Metals in Addison, Texas, wrote in a commentary:
"For the gold bugs who use dollar cost averaging to play in the gold market, this pullback is just another opportunity to take advantage of a product that still has upside potential.”
“Significant global debt, trade disputes, a pause on rate hikes and a slowing economy should help the price in the long run.”
