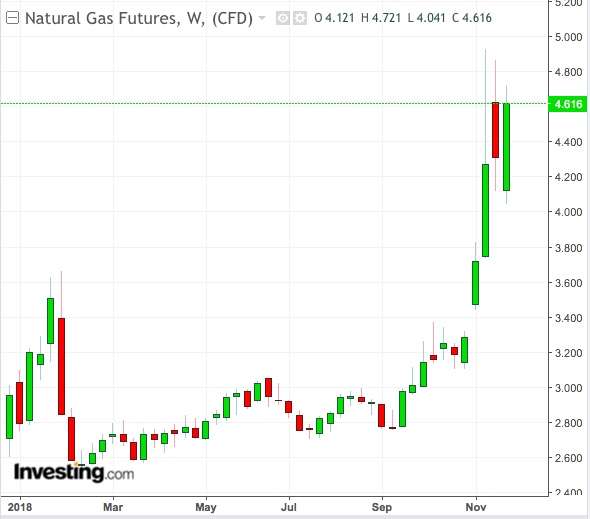
Natural gas's ranking as the No. 1 commodity of 2018 looks sealed. But each new week of the cold season is raising the bar for the level of heating demand the market has to meet. Each shortcoming could punish gas prices in the new year, especially if production of the fuel remains at record highs like now and market liquidity dries up like it has in crude oil.

At its Wednesday settlement of $4.70 for a million metric British thermal units (mmBtu) on the New York Mercantile Exchange, natural gas returned almost 60 percent to the investor who bought at the end of 2017 and held since. The next-best performing commodity for the year is oats, which shows a gain of just 23 percent (desktop users, click here and go to “performance” to see all commodity returns).
For gas to maintain its huge payout and stay at the $4 per mmBtu sweet spot, weekly draw numbers of the fuel from storage to help electricity generators meet heating demand are key. If those don’t come in line with expectations, then double-digit market swings could become the norm. Thinning market participation is already exacerbating volatility, causing daily moves of up to 19 percent lately.
'Cold December' Far From A Certainty
Scott Shelton, energy futures broker with ICAP in Durham, North Carolina, says the gas market’s biggest challenge might be that “a cold December is far from a certainty”.
Writing in his daily note, Shelton said:
“Anything can happen to Q1 2019 NatGas. I keep thinking about the crude market where prices move 2-3 percent daily for little reason and think that this also probable in NatGas for the time being as the market digests the prospects for December weather and salt storage.”
The first cold season gas draw of 2018/19 resulted in a pull of 134 billion cubic feet (bcf) from underground salt caverns during the week ending November 16, data from the US Energy Information Administration (EIA) showed.
That was the earliest triple-digit gas storage decrease for the month of November, according to federal energy data going back to 1994. The huge jump in gas demand that week overwhelmed analysts, who had been expecting a withdrawal of just around 109 bcf.
Demand Expectations Higher After Recent Draw
But the additional 25 bcf draw, coming after the so-called Alaskan Ridge weather phenomenon that caused one of the coldest pre-winter weeks in the US Northeast—which serves as a bastion for gas-powered heating—may have brought its own pricing problems.
That’s because the EIA’s next gas supply-demand reading, due at 10:30 AM ET (15:30 GMT) today and meant for the week ending November 23, is expected to show a pull of just 77 bcf by analysts estimates. While double the demand for gas seen during the same week a year ago, the next data will make up just over half of the previous 134-bcf draw.
Historically, temperatures from last week were lower than those from a year ago and a three-decade average. According to Reuters, there were 160 heating degree days (HDDs) for last week, versus 131 HDDs the same week a year ago and a 30-year average of 128 HDDs for the period. HDDs measure the number of degrees a day's average temperature is below 65 degrees Fahrenheit (18 degrees Celsius). The measure is used to estimate demand to heat homes and businesses.
Yet on a week-to-week basis, weather for the week ended November 23 was milder than that for the November 16 week.
Mixed Weather, Strong Production
Dan Myers, gas analyst at Gelber & Associates in Houston, expects last week’s draw from storage to be
“hampered by lower demand over the Thanksgiving weekend, mixed weather, and stronger production”.
Stronger production has, in fact, been a running theme in gas throughout this year.
The EIA expects production of dry natural gas to average an all-time high 83.2 bcf per day in 2018, and climb further to 89.6 bcf per day next year.
Large volumes of gas, sourced from primary drilling and also obtained in secondary form during drilling for shale crude, have led to record production of the fuel.
Bottom Line: 'Expect The Unexpected'
Despite such overwhelming output, storage levels of gas never reached the danger of overfilling, thanks to strong summer heat and, now, early cold that kept air-conditioners and heaters on overdrive.
If last week’s estimated 77-bcf draw comes through, it would leave storage at 3.036 trillion cubic feet (tcf), the lowest for this time of year since 2000. That would also be 18 percent below the same week a year ago and about 20 percent below the five-year average.
But if there are more freezes in the near-term, then triple-digit draws could be the norm rather than exception.
Says ICAP’s Shelton:
“The bottom line is to expect the unexpected as liquidity is terrible, and any type of flow will have a much larger effect on the market.”
