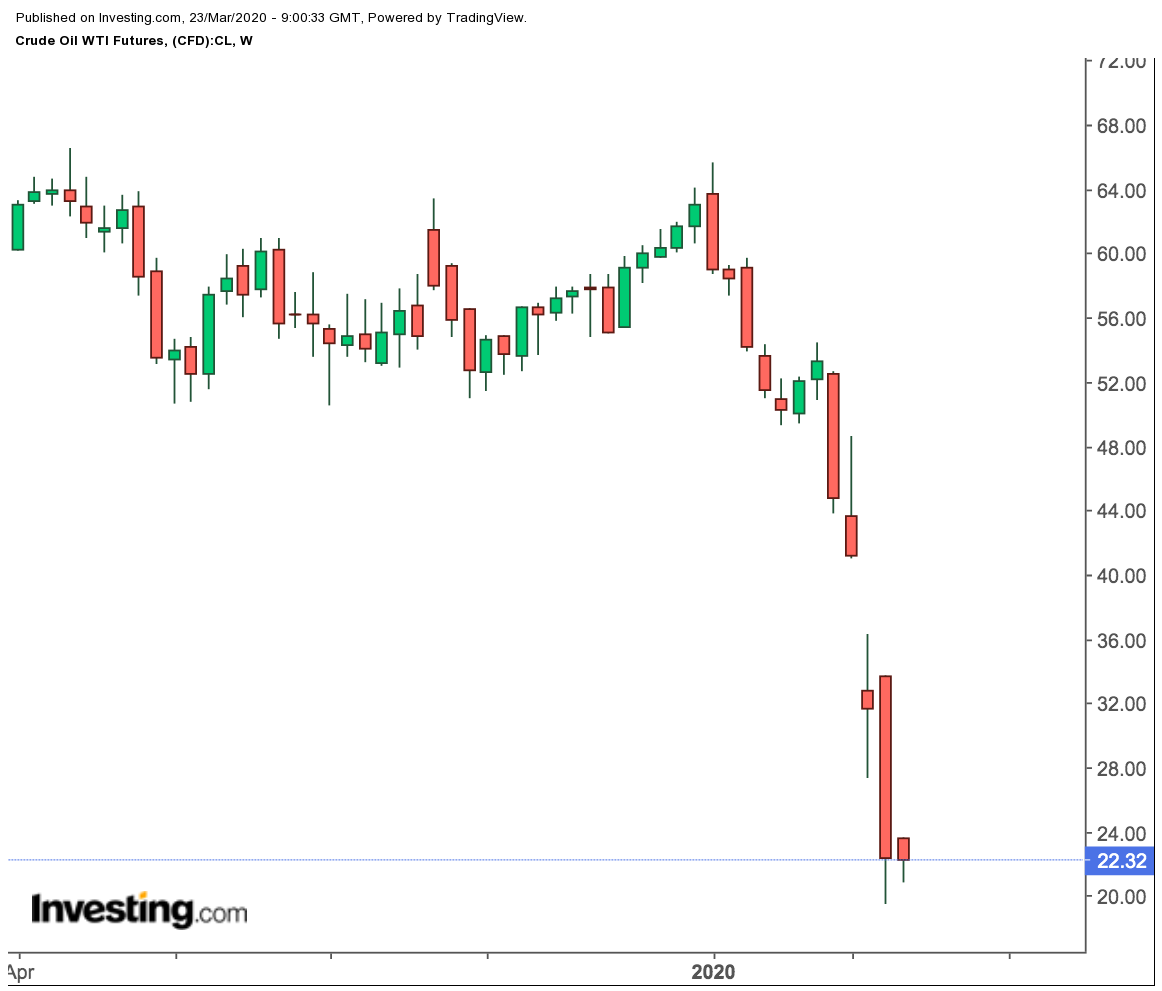
How long will it be before crude trades in the teens?
It's a question without doubt in the minds of us all, though another question to be asked is what will happen to shale oil at those prices.
West Texas Intermediate, the benchmark for U.S. crude, came within less than $1 of snapping the $20 per barrel support in Asian trade as the week opened to more coronavirus horrors in Italy and across Europe.
In the United States, the crisis reached a new dimension as at least one member of the Senate was reported infected and several others in self-quarantine as the assembly struggled to find common ground between President Donald Trump's party and rival Democrats on a massive relief package for the pandemic.
Total U.S. Covid-19 cases reached nearly 35,000, growing at a pace of 2,000 a day, while deaths approached 500.
It’s important to remember that regardless of the stimulus or whatever diplomatic maneuver the Trump administration has in mind to restore the failed OPEC+ production pact between the Kremlin and Riyadh, physical demand for oil will take time to return.
WTI at below $20 looks more plausible than ever, with hundreds of millions of people locked in their homes and not driving, flying or doing the things they usually do to get the oil in the tanks moving and refilled.
Largest Ever Oil Surplus Looming
“The largest oil supply surplus the world has ever seen in a single quarter is about to hit the global market from April, creating an imbalance of around 10 million barrels per day (bpd),” analysts at Rystad Energy said in a note.
Supply could surpass oil demand by an average of nearly 6 million bpd in 2020, resulting in an accumulated implied storage build of 2.0 billion barrels this year, the consultancy estimated.
“Based on our rigorous analysis, we find that the world currently has around 7.2 billion barrels crude and products in storage, including 1.3 billion to 1.4 billion barrels currently onboard oil tankers at sea,” its analysts said.
Further, the consultancy estimated that, on average, 76% of the world’s oil storage capacity was already full and current average filling rates indicated by balances were unsustainable.
“At the current storage filling rate, prices are destined to follow the same fate as they did in 1998, when Brent fell to an all-time low of less than $10 per barrel,” said Paola Rodriguez-Masiu, Rystad Energy’s senior oil markets analyst.
For Balance, Capex/Rig Cuts May Follow
As Dominick Chirichella of the Energy Management Institute in New York noted, U.S. crude production remained at a record high of 13.1 million bpd last week despite the oil rig count being down by 152 or 18% year-on-year.
U.S. oil drillers were currently deploying 664 rigs versus an October 2014 high of 1,609, but producing 4.23 million bpd more oil. “This is a production gain of 3.6 times more per rig,” said Chirichella.
Indeed, if U.S. crude slipped below $20 — or even spends a sustained period under $30 — the financial havoc brought on shale producers themselves might solve part of the problem for OPEC+ and the market.
“We’re going to see a new level of capex cuts and production discipline that could amaze us,” said John Kilduff, founding partner at New York energy hedge fund Again Capital, adding:
“It’s the only choice drillers across the U.S. have: cut or go bankrupt.”
Until now in 2020, only one firm in the U.S. oil patch — Pioneer Energy Services (OTC: PESXQ) — has filed for bankruptcy.
But many others, like Chesapeake Energy (NYSE:CHK) and Whiting Petroleum (NYSE:WLL) were already carrying heavy debt burdens before this month’s 55% drop in crude prices. Several have now moved toward slashing expenditure, exploration and production.
Pioneer, one of the leading producers in the Permian Basin of Texas and New Mexico, said it was running a series of lower output models to decide on next steps.
EOG Resources (NYSE:EOG) also said it planned cutbacks, Diamondback Energy (NASDAQ:FANG) reduced its completion crew from nine to six while Parsley Energy (NYSE:PE) slashed its 2020 free cash flow outlook to at least $85 million from a prior view of at least $200 million. Continental (NYSE:CLR) said it will reduce its average rig count in the Bakken to 3 from 9 currently, and in Oklahoma to 4 from 10.5.
Gold Between Rock And Hard Place
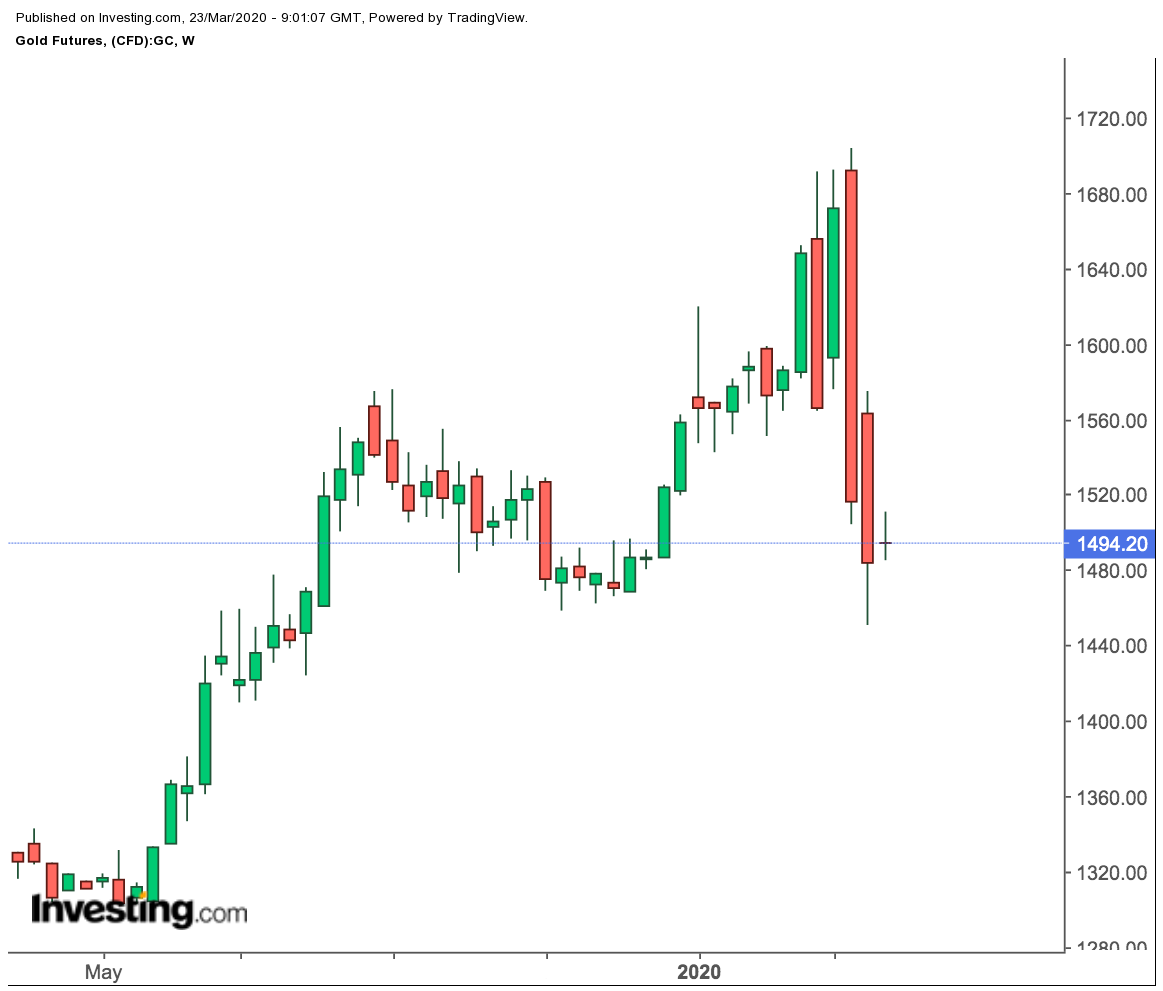
In gold’s case, a retest of $1,500 levels is likely this week though holding there might still be a problem.
U.S. gold futures hit an eight-month low of just above $1,450 an ounce last week, extending the previous week’s drop of 9.3%, which was its worst slide in 37 years. The yellow metal lost its $1,500 perch as investors liquidated their longs to raise cash as the Dow crashed beneath the key 20,000 point level.
“Gold is really caught between a rock and a hard place and that’s depreciating its safe haven label,” said Tariq Zahir, founder of New York-based Tyche Capital Advisors, which runs a Global Macro Commodities Program.
“For now, all eyes are on the Dow taking it on the chin, though for some that also means a buying opportunity to get in [to gold] at below $1,500.”
