by Pinchas Cohen
Background Macro
From an economic perspective, China's back has been against the ropes for some time now. But, credit should be given up front: After the 2007-2008 crash, China was the economic locomotive that pulled the free world out of the abyss.
However, global equities stalled in 2015 because of fear that a Chinese real estate bubble was in progress, but, China's economy just kept on chugging along. It wasn't until the Trump reflation trade appeared that equities actually advanced.
And it was the promise of US growth, not China's, that led global equities to their current record highs. In 2016, China’s economy reached a new low with growth of 6.7 percent, its slowest pace since 1990.
China’s efforts at the beginning of this year to stanch capital flight acerbated its financial system. Crackdowns on leveraged transactions led to additional capital outflows, further weighing on the economy. The continuous pumping of liquidity to support China's equity prices resembles nothing so much as the boy who sticks his finger in the dam in order to stop the leaks, but like the boy when confronted by too many leaks, China may soon run out of fingers.
Moody’s first downgrade of China in nearly three decades which occurred last week, was prompted by the country's rising debt, and may have been the final nail in the coffin of China’s economic expansion. Today’s Caixin Manufacturing PMI release showed that the indicator had fallen below the 50 mark, which signals that manufacturing activity has shifted from expanding to contracting, for the first time in eleven months.
This read is in stark contrast to yesterday's official, government report, which showed a steady PMI. Moreover, yesterday's 51.2 beat expectations, suggesting that a manufacturing recovery is spreading to the smaller, private sector.
Could this be another example of why investors are losing faith in Chinese government data? Or was this a fluke, the result of a smaller sample for the Caixin release than for the official study? Some believe the private study may rely on earlier evidence of a Chinese contraction, after a momentum decline in metal prices suggests that China’s factory reflation is over.
Trading China’s Slowdown
So China has its back against the ropes. Is it time to assume a defensive posture or to go in for the profit knock-out?
Last week we published Trading China’s Credit Rating Cut. In that post we predicted that iron ore and the Aussie dollar would decline, since China is Australia’s biggest trade partner. That forecast was accurate; iron ore has declined by 11% since the post appeared, and the Aussie dollar declined by 1.333%.
Economic developments and the technical supply-demand dynamic suggest a further decline. They also indicate an additional decline in oil, since China is the world's biggest oil importer.
If a contracting economy is expected to reduce Chinese demand for iron ore—and its biggest exporter's currency, the Australian dollar—it stands to reason it should also reduce the country's demand for oil. The IEA expects China’s oil demand to grow to 400,000 bpd to 12.3m bpd, making China’s demand a third of global demand growth estimated at 1.3mbd.
However, if China’s economy contracts, growth estimates will be seriously off target, affecting oil prices accordingly. We may now be getting a whiff of the fumes generated in April when Chinese gasoline demand fell 6.3%, the sharpest slump since March 2010.
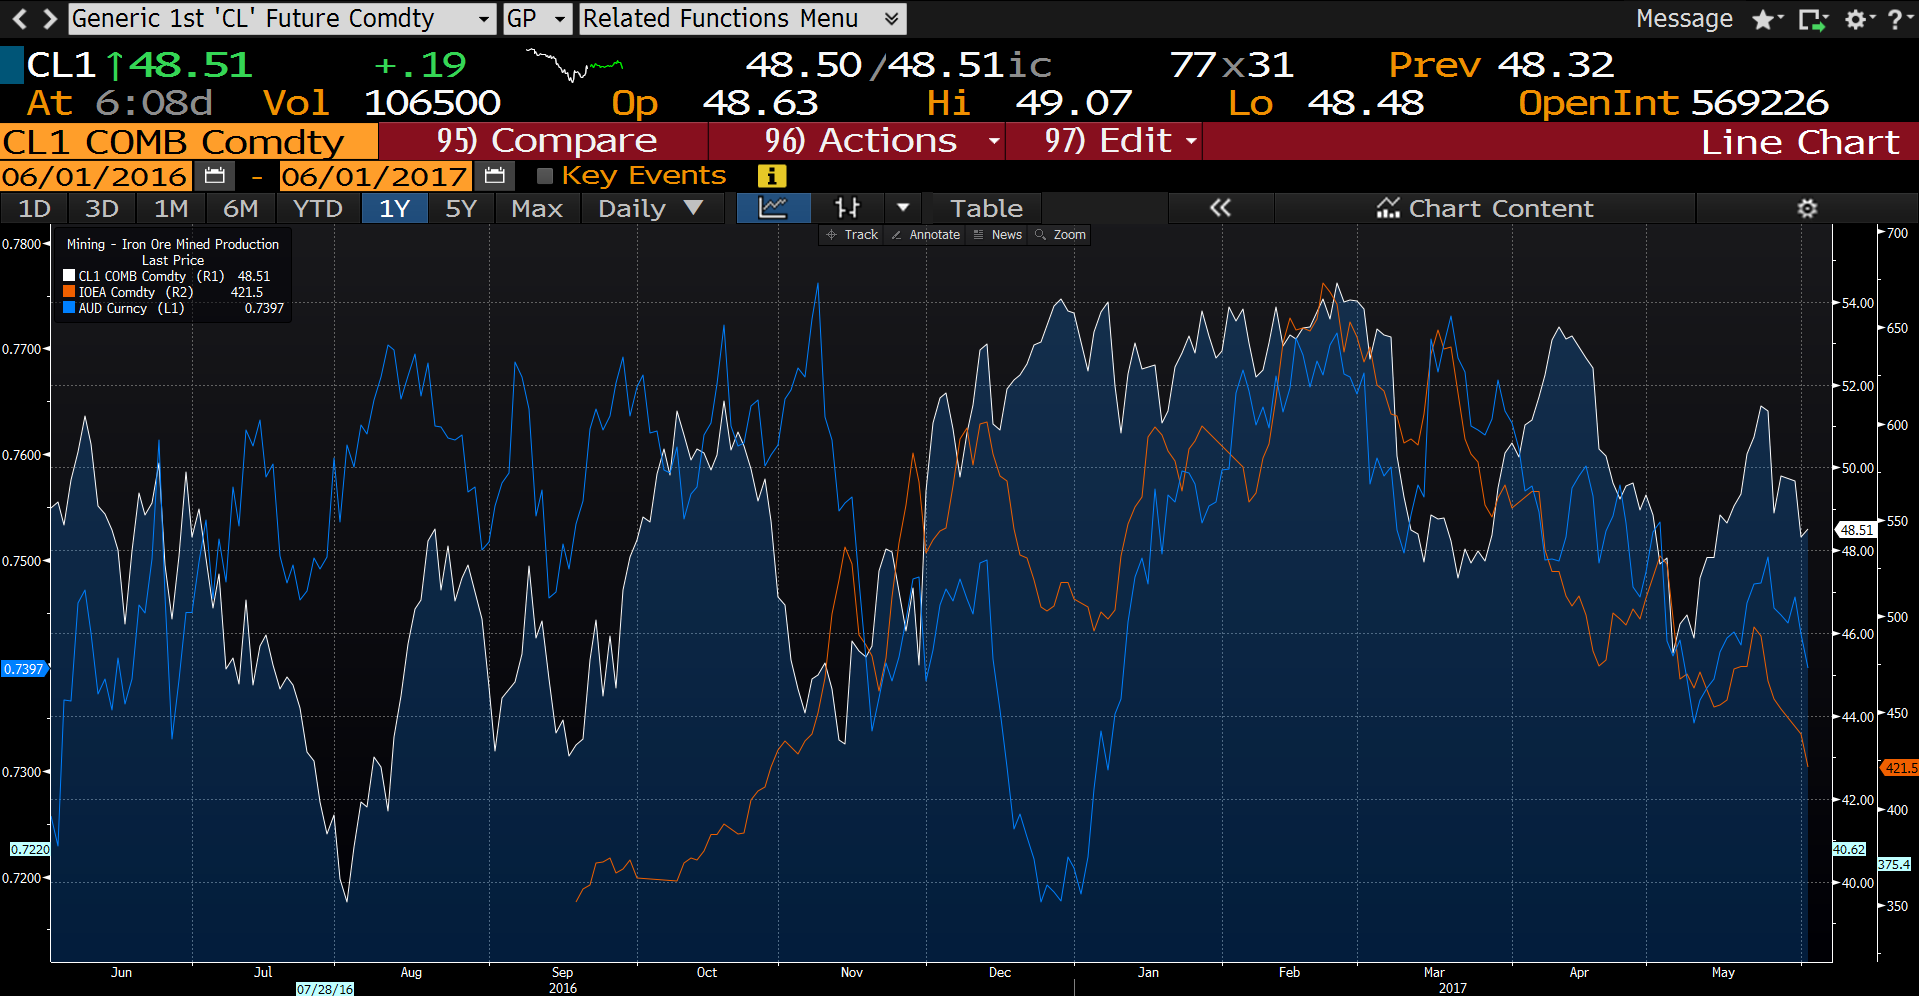
The following chart shows the positive correlation between the AUD, iron ore and oil this year. A demand slowdown could change this picture considerably.

Iron Ore
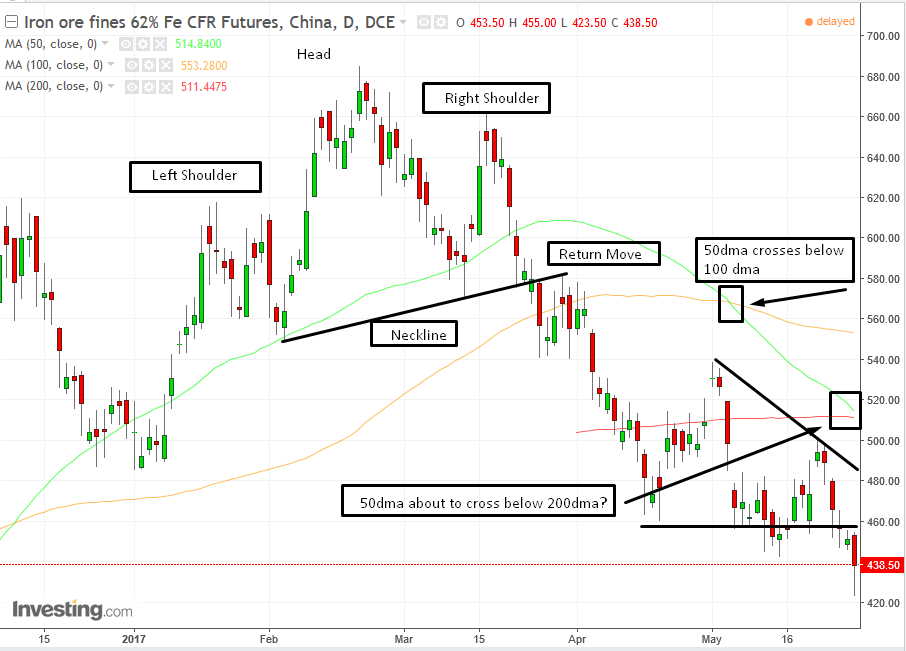
Between January and March of this year, the price of iron ore completed a bearish H&S top, with a high of $99.52, which demonstrated that the trend was reversing.

It completed a successful return move on March 30, retesting the neckline’s now-resistance, with a high of $84.33. The pattern’s target price implied a move of $16, the height of the pattern, which materialized on April 18, when the price reached the low of $67.42.
However, we believe the expectation that China's economy has peaked for the year, along with the shifting momentum in trader supply and demand suggest the asset's decline will continue. Since achieving the H&S’s target price, iron ore has been trading within a descending triangle pattern, suggesting that selling is overcoming demand.
While supply initially came in only at the height of $78.25 on May 2, the second time, sellers settled for the lower price of $73 on May 22.
While sellers were willing to sell at lower prices, demand was not willing to buy at higher prices, demonstrating the over-eagerness of the sellers. When the price finally closed clear of the triangle’s bottom on May 31, with a close of $64.31, the pattern completed. The height of the pattern at $10, suggests a price target of $57.
The 50dma (green) crossed below the 100dma (orange) on May 5—demonstrating that the recent price average is weakening relative to the longer price average, suggesting price momentum is heading lower, and is approaching a “dead cross” if it crosses below the 200dma (red).
AUD/USD

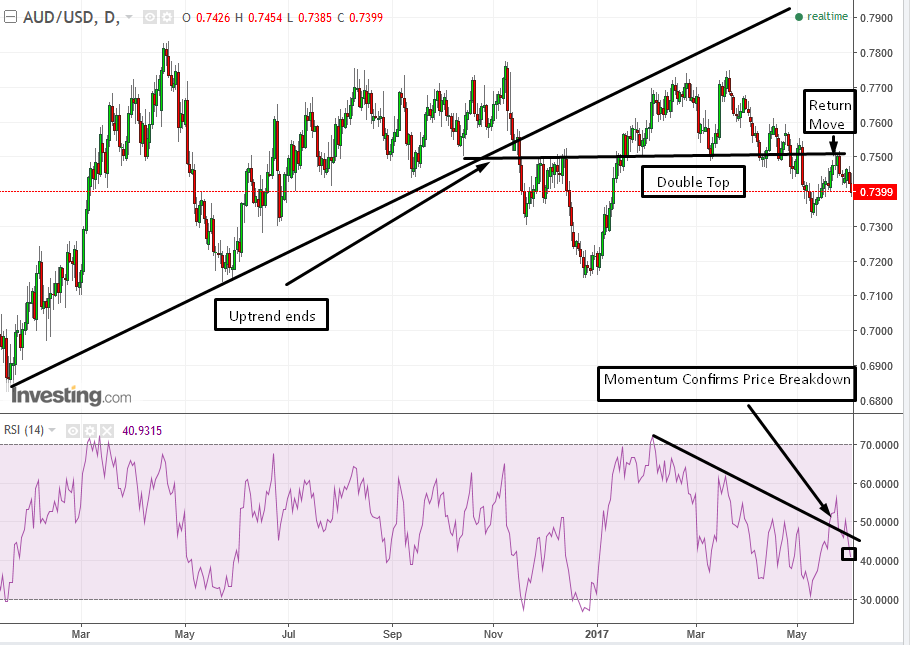
Since it's a loyal companion to iron ore, the AUD completed a bearish double top at the same time as the commodity. It was completed with a decisive downside breakdown when the price declined sharply on May 3 to 0.7420 with a close just 3 pips higher, openly showing that the bears were driving.
Notice that the RSI provided a “heads up” when it declined, as opposed to the second peak of the top, which climbed, providing a negative divergence between the price and its momentum.
However, unlike iron ore, the Aussie dollar had yet to achieve its price target of 240 pips, the height of the double top, which gives traders an opportunity. The pattern’s bearish nature was confirmed when a return move retested the neckline over three consecutive days, between May 23 and May 25, each time touching the neckline but unable to overcome it.
Since then, the price of the pair declined to 0.7396, leaving just another 1.7% to achieve the target price of 0.7264. However, the staunch support would be at around 0.7200, because in addition to being a round number—providing psychological support—this level has also been the bottom on a number of occasions, during May 2016 and December-January.

Oil traders' hopes were dashed when OPEC ruled out Russia’s proposal of an option to add an additional 3-months worth of cuts; they were knocked out completely when the deal disappointed expectations on the depth of cuts, following the US government warning that the proposed cuts wouldn’t put a dent in the global glut. The real risk however may turn out to be China’s contracting economy.
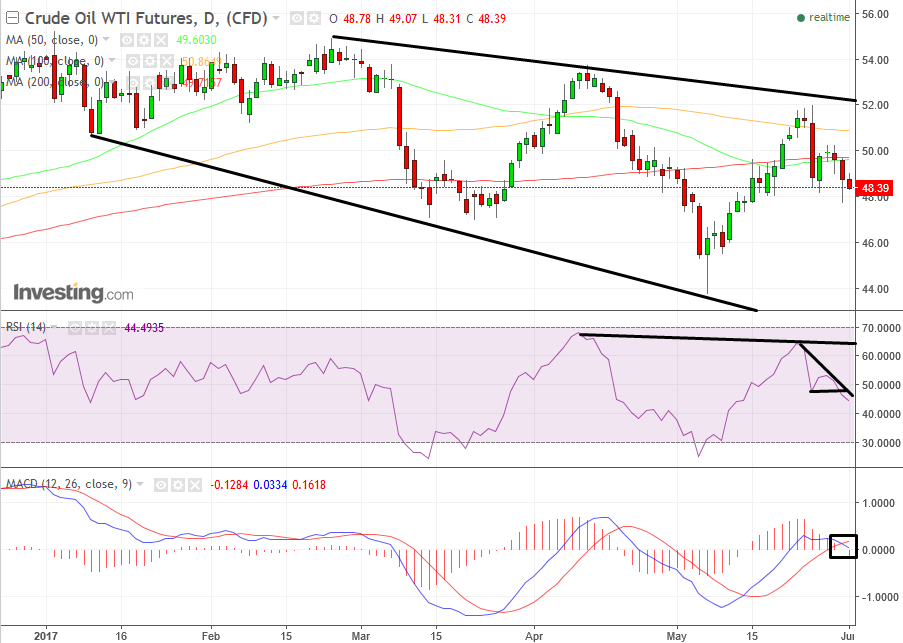
After the price of oil reached a peak of $55.24 on December 12, it failed to continue the uptrend by making higher peaks. Since then, it has made lower peaks and lower troughs, as its trading pattern was trapped within a falling channel, with both supply and demand agreeing to ever lowering prices.
Last week’s post, Has Oil's Rally Just Hit the Skids?, predicted a price decline. The forecast was correct: oil's price fell from $50.55 to a low of $47.73 yesterday, a decline of 5.62%.
The decline fell below the major 50, 100 and 200 day moving averages.
The RSI reveals that the momentum bias has been to the downside, as both troughs within the channel ventured into oversold territory, while the price advances didn’t enter the overbought domain, a sign of where the pressure is within the supply-demand balance. The RSI has been producing lower highs and lows since its last peak.
At the same time the MACD hasn’t been able to climb and is falling back into decline territory while providing a sell signal, as the shorter moving average crosses below the longer moving average, demonstrating that recent prices are becoming weaker. Should the falling channel remain intact, prices should retest the $45 level, which could even happen shortly.
